Section 4: Technical Insights on Commodity of the Week
Negative Price Reaction Across Commodities, One Commodity in a Negative Zone - Coffee C
Coffee C July Futures (ICE: KCN3)
Price Action and Technical Indicator Analysis:
Coffee C July Futures' prices are trading below the rising trendline support zone and facing resistance from the trendline on the upside, indicating the possibility of a downward movement hereon. The leading indicator RSI (14-period) is showing a reading of ~47.49, indicating negative price momentum. Moreover, the prices are trading below the 21-period and 50-period SMAs, which may act as a resistance level.
Now the next crucial support levels appear to be at USc 174.36 and USc 170.0, and prices may test these levels in the coming sessions (1-2 weeks).
Coffee C July Futures (ICE: KCN3) is looking technically well-placed for a ‘Sell’ rating. Technical summary of ‘Sell’ recommendation is as follows:
Coffee C's (KCN3) Technical Analysis Summary
| Rating |
Exchange |
Contract Month |
Entry Level # |
Target 1* |
Target 2* |
Stop Loss |
| Sell |
ICE |
July Features |
USc 183.05 |
USc 174.36 |
USc 170.00 |
USc 190.00 |
Source: Kalkine Group; Data as on June 02, 2023 Chicago, IL, USA 01:35 AM (GMT -5)
*Target Price can vary by +/- 0.50%
Futures Contract Specifications
| Commodity Futures |
Exchange |
Contract Month |
Expiry Date |
Lot Size |
Tick Size |
| Coffee C |
ICE |
Jul-23 |
18-Jul-23 |
37,500 Pounds |
5/100 cent per lb |
Source: ICE Group
Risk Reward Ratio
Based on the technical analysis, the risks are defined as per risk-reward ratio (~0.80:1.00), however, returns are generated within 1-2 weeks’ time frame.
Section 5: Technical Analysis Driven Stock Pick
Pilbara Minerals Limited
Pilbara Minerals Limited (ASX: PLS) is a pure-play lithium company based in Australia. The company is primarily engaged in the exploration, development, and mining of minerals in Australia. Its fully owned Pilgangoora hard-rock lithium operation is located nearly 120kms away from Port Hedland in Western Australia’s Pilbara region.
Pilbara Minerals Limited (ASX: PLS) Technical Summary
| Price(AUD) |
Support 1 (AUD) |
Support 2* (AUD) |
Resistance 1# (AUD) |
Resistance 2# (AUD) |
RSI Daily(14-Period) |
SMA 21-Period |
| 4.460 |
4.000 |
3.700 |
5.000 |
5.400 |
~50.60 |
4.650 |
Data Source: REFINITIV, Analysis: Kalkine Group
* Support 2 can be considered as an indicative stop-loss, and if prices move below that level on closing basis, individuals may evaluate exiting the position depending on their risk appetite, previous holdings, and other factors considered. The support and resistance levels may need to be re-evaluated within 4-6 weeks' time frame depending on the stock price movements form the date of recommendation on the stocks.
#Resistance Levels can vary by +/- 1.5%
PLS’ Technical Analysis:
On the daily chart, PLS prices are sustaining above the horizontal trendline breakout level and taking support from the same. Moreover, the momentum oscillator RSI (14-period) is showing a reading of ~50.60 level. Further, the prices are trading above the trend-following indicator 50- period SMA, which may act as support zone. An important support level for the stock is placed at AUD 4.00 while the key resistance level is placed at AUD 5.00.
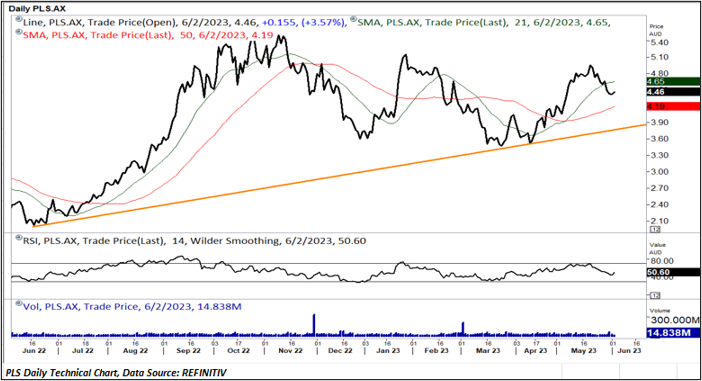
Considering the company’s current prices are sustaining above the rising trendline and momentum oscillator analysis; therefore, a “Buy” recommendation is given on the stock. The stock was analysed as per the current price of AUD 4.46 (as of June 02, 2023, at 10:06 AM GMT+10).
Risk Reward Ratio
Based on the technical analysis, the risks are defined as per risk-reward ratio (~0.85:1.00), however, returns are generated within 4-6 weeks’ time frame.
Disclaimer
Related Risks: This may be looked at by Individuals with sufficient risk appetite looking for returns within short investment duration. Investment recommendations provided in this report are solely based on technical parameters, and fundamental performance of the commodities has not been considered in the decision-making process. Other factors which could impact the commodity prices include market risks, regulatory risks, interest rates risk, currency risks, and social and political instability risks etc.
Note 1: Past performance is not a reliable indicator of future performance.
Note 2: Individuals can consider exiting from the commodity and or stock if the Target Price mentioned as per the Technical Analysis has been achieved and subject to the factors discussed above.
Note 3: How to Read the Charts?
The Green colour line reflects the 21-period moving average while the red line indicates the 50- period moving average. SMA helps to identify existing price trend. If the prices are trading above the 21-period and 50-period moving average, then it shows prices are currently trading in a bullish trend.
The Black colour line in the chart’s lower segment reflects the Relative Strength Index (14-Period) which indicates price momentum and signals momentum in trend. A reading of 70 or above suggests overbought status while a reading of 30 or below suggests an oversold status.
The Blue colour bars in the chart’s lower segment show the volume of the stock. The volume is the number of shares that changed hands during a given day. Stocks with high volumes are more liquid than stocks with lesser volume as liquidity in stocks helps in easier and faster execution of the order.
The Orange colour lines are the trend lines drawn by connecting two or more price points and used for trend identification purposes. The trend line also acts as a line of support and resistance.
Note 4: Trading decisions require a thorough analysis by individuals. Technical reports in general chart out metrics that may be assessed by individuals before any commodity evaluation. The above are illustrative analytical factors used for evaluating the commodity; other parameters can be looked at along with additional risks per se.
Technical Indicators Defined
Support: A level at which the stock prices tend to find support if they are falling, and a downtrend may take a pause backed by demand or buying interest. Support 1 refers to the nearby support level for the stock and if the price breaches the level, then Support 2 may act as the crucial support level for the stock
Resistance: A level at which the stock prices tend to find resistance when they are rising, and an uptrend may take a pause due to profit booking or selling interest. Resistance 1 refers to the nearby resistance level for the stock and if the price surpasses the level, then Resistance 2 may act as the crucial resistance level for the stock.
Stop-loss: It is a level to protect further losses in case of unfavorable movement in the stock prices.
Disclaimer
This report has been issued by Kalkine Pty Limited (ABN 34 154 808 312) (Australian financial services licence number 425376) (“Kalkine”) and prepared by Kalkine and its related bodies corporate authorised to provide general financial product advice. Kalkine.com.au and associated pages are published by Kalkine.
Any advice provided in this report is general advice only and does not take into account your objectives, financial situation or needs. You should therefore consider whether the advice is appropriate to your objectives, financial situation and needs before acting upon it.
There may be a Product Disclosure Statement, Information Statement or other offer document for the securities or other financial products referred to in Kalkine reports. You should obtain a copy of the relevant Product Disclosure Statement, Information Statement or offer document and consider the statement or document before making any decision about whether to acquire the security or product.
You should also seek advice from a financial adviser, stockbroker or other professional (including taxation and legal advice) as necessary before acting on any advice in this report or on the Kalkine website. Not all investments are appropriate for all people.
The information in this report and on the Kalkine website has been prepared from a wide variety of sources, which Kalkine, to the best of its knowledge and belief, considers accurate. Kalkine has made every effort to ensure the reliability of information contained in its reports, newsletters and websites. All information represents our views at the date of publication and may change without notice.
Kalkine does not guarantee the performance of, or returns on, any investment. To the extent permitted by law, Kalkine excludes all liability for any loss or damage arising from the use of this report, the Kalkine website and any information published on the Kalkine website (including any indirect or consequential loss, any data loss or data corruption). If the law prohibits this exclusion, Kalkine hereby limits its liability, to the extent permitted by law, to the resupply of services.
Please also read our Terms & Conditions and Financial Services Guide for further information.
On the date of publishing this report (referred to on the Kalkine website), employees and/or associates of Kalkine and its related entities do not hold interests in any of the securities or other financial products covered on the Kalkine website unless those persons comply with certain safeguards, procedures, and disclosures.
Kalkine Media Pty Ltd, an affiliate of Kalkine Pty Ltd, may have received, or be entitled to receive, financial consideration in connection with providing information about certain entity(s) covered on its website.