Kalkine has a fully transformed New Avatar.
Company Overview: Alacer Gold Corp. is an intermediate gold mining company. The Company is engaged in mining, development and exploration of mineral deposits in Turkey. The Company's segments include Turkish Business Unit and Corporate and other. It is engaged in the acquisition, exploration and production of gold in Turkey. The Company has interest in the Copler Gold Mine in Turkey operated by Anagold Madencilik Sanayi ve Ticaret A.S. (Anagold). The Copler Gold Mine is an open-pit, heap-leach operation that produces gold from oxide ore. The Copler orebody also contains refractory sulfide ore. The Copler Mine is located in east-central Turkey in the Erzincan Province, approximately 1,100 kilometers southeast from Istanbul and 550 kilometers east from Ankara, Turkey. The Company operates Copler Sulfide Expansion Project. The Company focuses on Cakmaktepe North, Cakmaktepe Central, Cakmaktepe Southeast, Cakmaktepe East and Bayramdere prospects.
.png)
AQG Details
Decent Top-line and Bottom-line CAGR over FY16-18: Leading low-cost intermediate Canadian gold producer, Alacer Gold Corp. (ASX: AQG) has 80% interest in the world-class Çöpler Gold Mine in Turkey, with remaining 20% stake with Lidya Mining. The Çöpler mine is in east-central Turkey in the Erzincan Province around 550 km east from Ankara, Turkey’s capital city and 1,100 kilometers southeast from Istanbul. Its primary focus is to leverage its balance sheet to maximize free cash flow, carry-on its organic multi-mine growth strategy, etc. Looking at the past performance over FY16 to FY18, total revenue and net income of the company have grown with a CAGR (compounded annual growth rate) of 15.06% and 56.06%, respectively. Group’s total revenue improved from US$142 Mn in FY16 to US$188 Mn in FY18, and net income improved from US$6.2 Mn in FY16 to US$15.1 Mn in FY18.
FY19, for the company, was proved a successful FY19 with delivering on its strategic, operational and financial objectives. Its two producing plants’ consolidated production stood at 391,213 ounces at an unaudited All-in Sustaining Costs (AISC) of $710 an ounce, and the result can be attributed to successful ramp up of the sulfide plant coupled with the ongoing in-pit exploration success allowing the company to increase oxide production guidance twice last year. It further resulted into unlevered free cash flow of over US$215 million and reduced the net debt to US$47 million, giving financial flexibility for the next leg of growth.
AQG in a previous update, announced an increase to the production guidance range for Çöpler oxide plant for 2019 from 125,000 to 145,000 ounces to 150,000 to 160,000 ounces, because of stacking ore from the ongoing in-pit exploration success, better than predicted outcomes from the blended ore program, and positive reconciliation for the oxide ore. The sulfide plant gold production for 2019 has been estimated at 230,000 to 270,000 ounces. In a recent update, the company highlighted that it has achieved the production guidance for FY19 and has provided a positive estimate for FY20.
.png)
YTD 2019 Operational Highlights (Source: Company Reports)
Q3FY19 Key Highlights for the period ended September 30, 2019:Attributable earnings for the third quarter was reported at $34.8 million, with normalized attributable earnings at $34.1 million. Cash position (consolidated) at the end of the quarter was reported at $188 million, with debt of $298 million, resulting in reduction in net debt to $110 million. Around 289,701 ounces of gold was sold through September 30, 2019, resulting in total gold sales proceeds of $396 million.
Revenue from the quarter was reported at $144.0 million, an increase of 306% on the previous corresponding period, mainly attributed to a 233% increase in gold ounces sold and from a 22% higher average realized gold price. Moreover, there wasn’t any revenue recognized from the sulfide plant in the third quarter of FY2018. Total cost of sales for the period was reported at $78.4 million, an increase of 257% on the previous corresponding period, in-line with the higher revenues.
Other costs included general and administrative expenses of $2.11 million, finance expenses of ~6 million, etc. Working capital as on September 30, 2019, was reported at $167.6 million, an increase of $70.8 million, primarily due to an increase in Cash and Cash Equivalents and inventories offsetting the increase in Trade and Other Payables. Cash flow from operating activities excluding pre-commercial sulfide plant production was reported at $160.5 million.
.png)
Q3FY19 Key Financial Metrics (Source: Company Reports)
Top 10 Shareholders: The top 10 shareholders have been highlighted in the table, which together form around 6.16% of the total shareholding. Vanguard Investments Australia Ltd. and IPConcept (Luxemburg) S.A. hold maximum interests in the company at 2.62% and 1.54%, respectively..png)
Top 10 Shareholders (Source: Thomson Reuters)
A Quick Look at Key Metrics: Its gross margin, EBITDA margin and net margin for Q3FY19 stood at 45.6%, 54.4% and 31.5%, better than the industry median of 40.3%, 32.7% and 5.5%, implying decent fundamentals for the company. Its current ratio for Q3FY19 stood at 2.31x, better than the industry median of 2.22x, which implies that the company is in a good position to address its short-term obligations. ROE for Q3FY19 stood at 4.5%, better than the industry median of 1.0%, which implies that the company generated better returns for its shareholders than its peer group..png)
Key Metrics (Source: Thomson Reuters)
Key Risks: The company is susceptible to certain risks such as political, economic, monetary policy, and other risks in Turkey along with credit risk, interest rate risk and foreign currency risk which may affect its future operations and financial position.
What to Expect: As per the latest release, the company expects its Çöpler Mine to provide another strong year of free cash flow with 2020 consolidated production guidance in the range of 310,000 - 360,000 ounces at consolidated All-in Sustaining Costs in the range of $735 - $785 per ounce. AQG is determined to materially improve the remaining life-of-mine production profile of its mine from the Çöpler District. In order to support a production profile of 300,000 to 400,000 ounces per year for at least the next 10 years, the company is well advanced in identifying a full spectrum of organic growth opportunities in the near, medium and long-term. The report comprising opportunities underpinning a refresh of the Çöpler NI 43-101 Technical Report, is expected to issue later of 2020 and will be a first step in defining the company’s exceptional growth potential.
Due to the continued ramp up of the sulfide plant and timing of scheduled shutdowns for the autoclaves, the consolidated production is expected to be lower in the first half of the year. Additionally, the ongoing in-pit exploration programs at Çakmaktepe and Çöpler are expected to continue to develop a number of near-term oxide ore targets. The sustaining capital expenditure has been estimated at $33 million, including $17 million for ongoing construction of the TSF lifts; $9 million for general items, which includes $2 million for optimization work on the sulfide plant; and $7 million for the ~6 million tonne heap leach pad expansion. The growth capital expenditure has been estimated at $49 million, including $23 million for accelerating construction of the TSF; $20 million for other growth initiatives, including the Çöpler District Technical Report that will deliver a holistic plan for the organic pipeline; and $6 million for work on the additional ~20 million tonne heap leach pad expansion.
The company has increased the 2020 exploration spend to $20 million, out of which $14 million is attributable to Alacer. The 2020 exploration program is expected to focus on growing oxide production through drilling at Ardich/Greater Çakmaktepe, the Çöpler Saddle, Çakmaktepe and Çöpler in-pit.
The fourth quarter and full-year 2019 operational and financial results are expected to get release on February 4, 2020.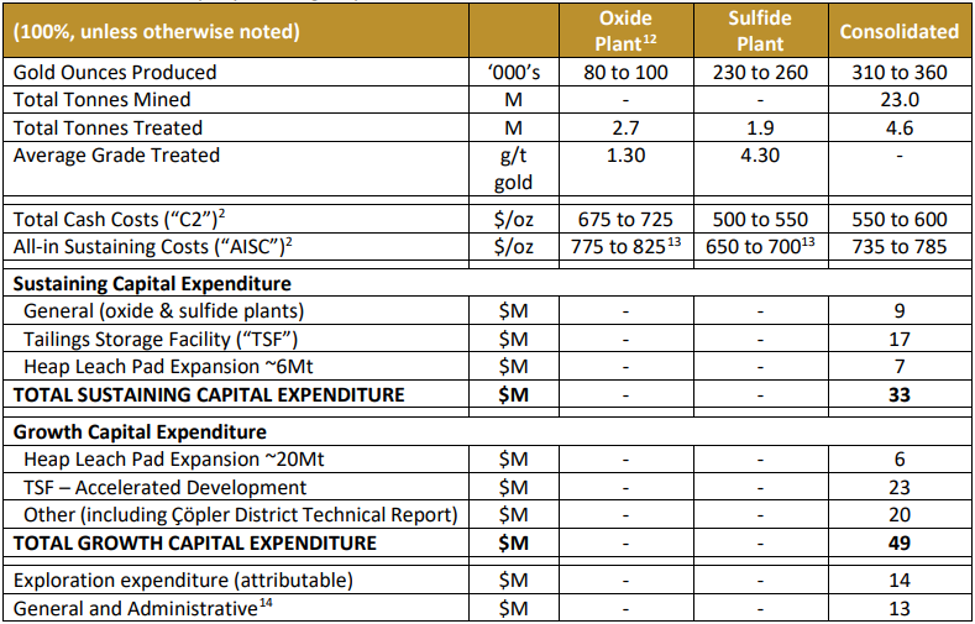
FY2020 Guidance for gold production and costs (Source: Thomson Reuters)
Gold Outlook: At the time of writing, the gold spot (XAU/USD) traded at a price of US$1,579.64 (15:37 (UTC+11)). As per technical analysis, on weekly timeframe chart, the stock broke an important resistance level of US$1,556.32 on account of recent war-like situation over US-Iran in the land of Iraq.
Recent mortars shelling at the U.S. embassy in Iraq is expected to escalate the tensions further, which may lead to an increase in oil supply concerns around the globe affecting the equity investments and shifting the exposure to the safe investments, i.e., “Gold”. The increase in gold prices would further help the gold miners around the world.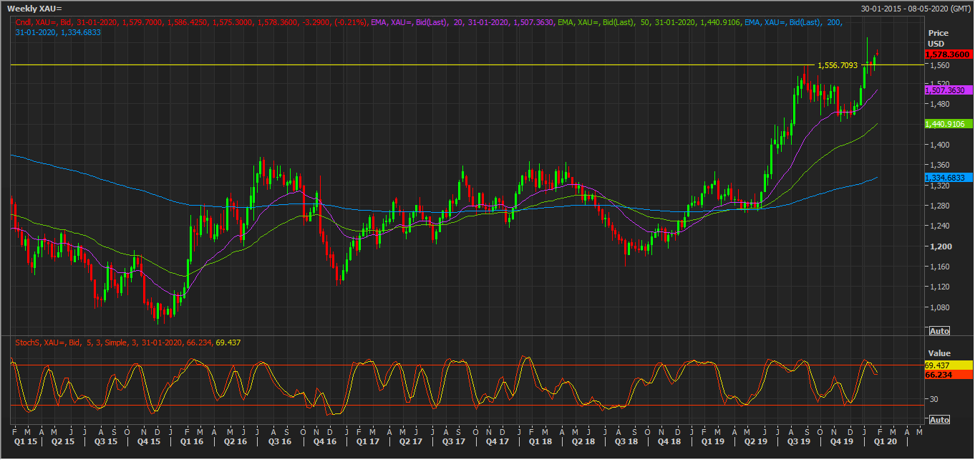
Weekly Chart for Gold Spot (XAU/USD) (Source: Thomson Reuters)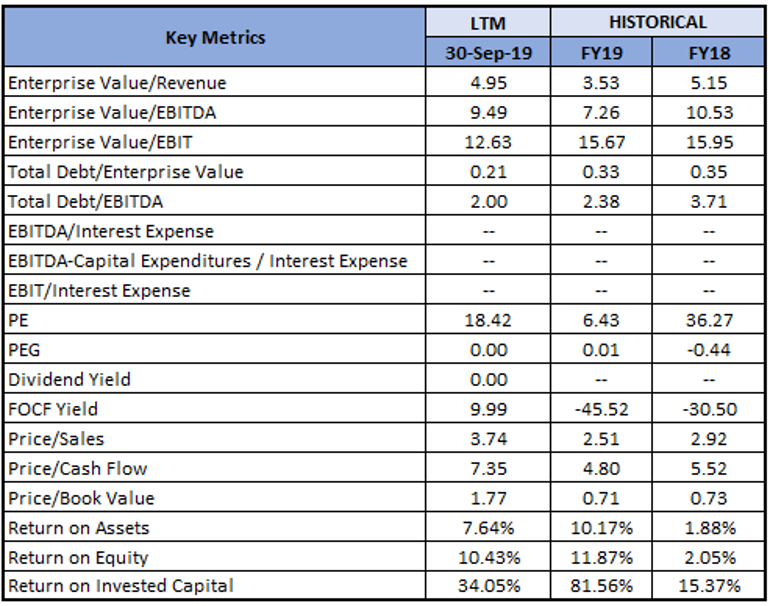
Key Valuation Metrics (Source: Thomson Reuters)
Valuation Methodology: EV/EBITDA Multiple Approach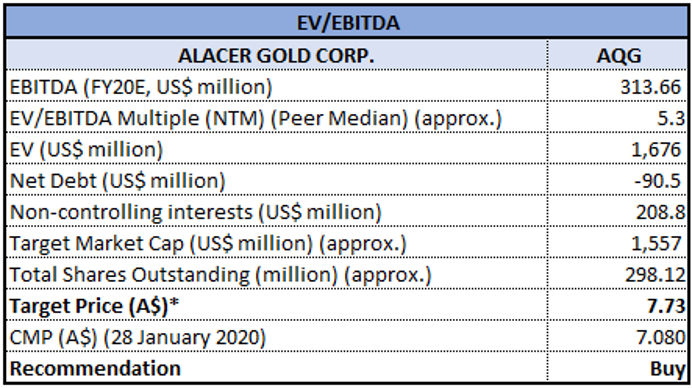
EV/EBITDA Multiple Approach (Source: Thomson Reuters), *1 USD = ~1.48 AUD
Note: All forecasted figures and peers have been taken from Thomson Reuters, NTM-Next Twelve Months
Technical Analysis:
Monthly Chart: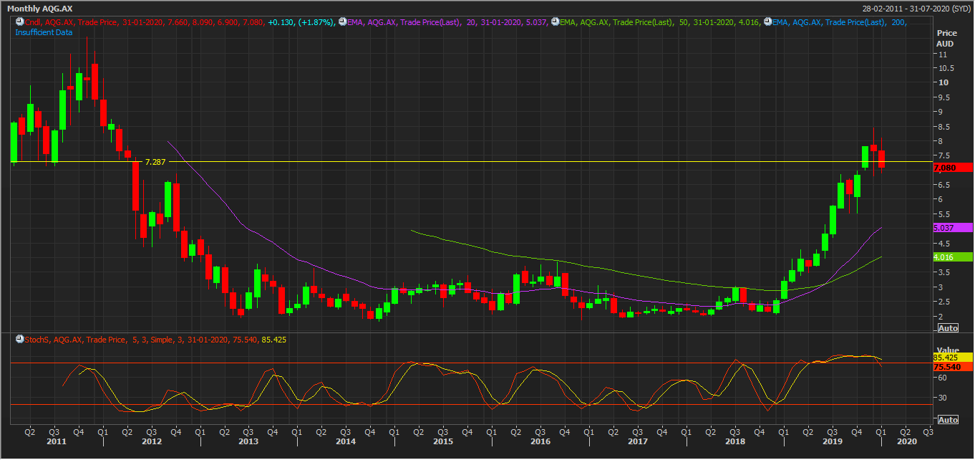
(Source: Thomson Reuters)
Weekly Chart: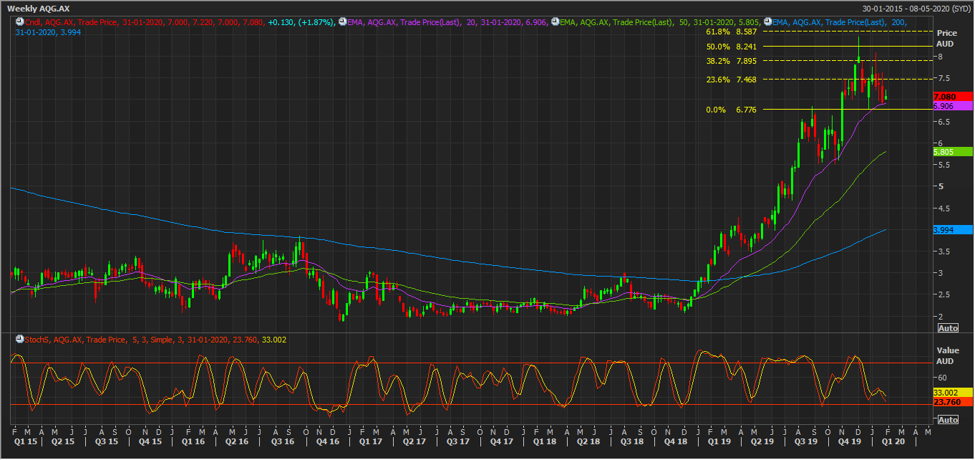
(Source: Thomson Reuters)
On both timeframe charts, the stock is trading above 20 EMA and 50 EMA, indicating bullish trend. Moreover, in weekly timeframe chart, a ‘bullish harami’ pattern at 20 EMA suggests there is a probability for continuation of trend for some time. The stock is expected to test the resistance level at around $7.468.
Note: EMA – Exponential Moving Average, RSI – Relative Strength Index
Stock Recommendation: AQG’s stock posted a positive six months return of 29.66%, and in the span of one year, it delivered a return of 124.92%. The company focuses on extending and improving oxide gold production by fast tracking the development of a number of near-mine oxide ore targets within the Çöpler pits and surrounding areas. Considering the company’s business operations, performance in FY19, profitability margins, FY20 guidance, gold outlook and current trading levels, we have valued the stock using a relative valuation method, i.e., EV/EBITDA multiple, and arrived at a high single-digit growth (in % terms). Hence, we give a “Buy” recommendation on the stock at the current market price of $7.080, up 1.871% on January 28, 2020.
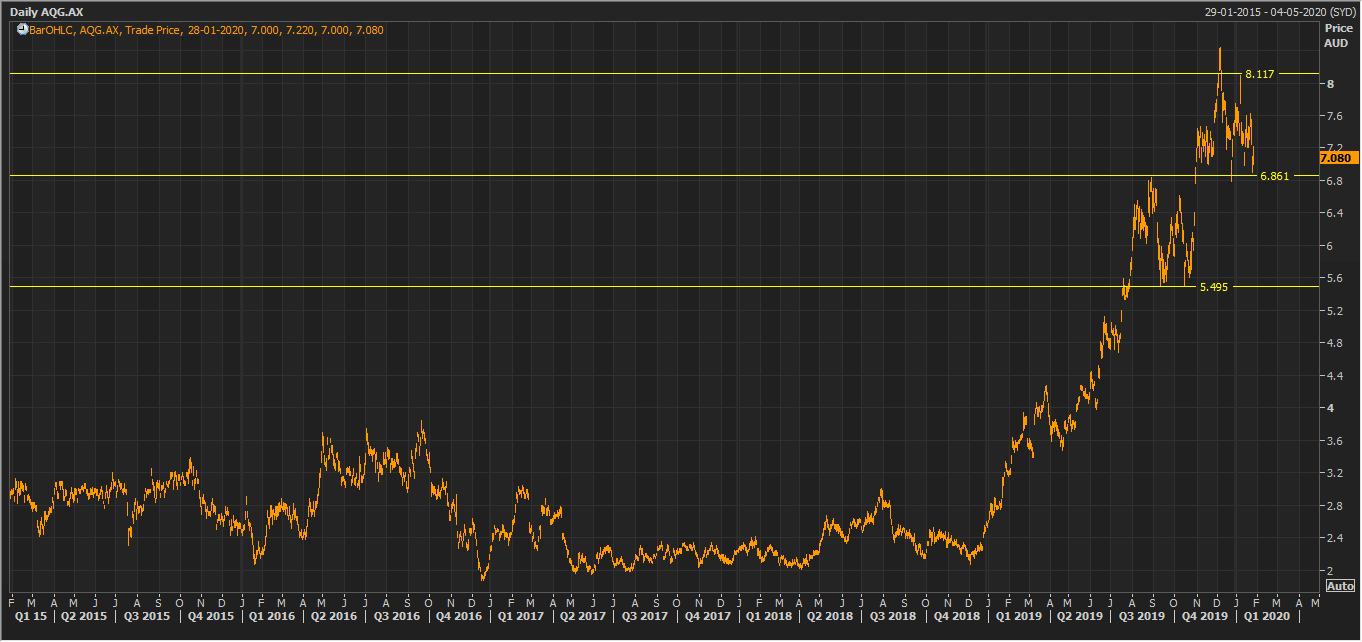
AQG Daily Technical Chart (Source: Thomson Reuters)
Disclaimer
The advice given by Kalkine Pty Ltd and provided on this website is general information only and it does not take into account your investment objectives, financial situation or needs. You should therefore consider whether the advice is appropriate to your investment objectives, financial situation and needs before acting upon it. You should seek advice from a financial adviser, stockbroker or other professional (including taxation and legal advice) as necessary before acting on any advice. Not all investments are appropriate for all people. Kalkine.com.au and associated pages are published by Kalkine Pty Ltd ABN 34 154 808 312 (Australian Financial Services License Number 425376). The information on this website has been prepared from a wide variety of sources, which Kalkine Pty Ltd, to the best of its knowledge and belief, considers accurate. You should make your own enquiries about any investments and we strongly suggest you seek advice before acting upon any recommendation. Kalkine Pty Ltd has made every effort to ensure the reliability of information contained in its newsletters and websites. All information represents our views at the date of publication and may change without notice. To the extent permitted by law, Kalkine Pty Ltd excludes all liability for any loss or damage arising from the use of this website and any information published (including any indirect or consequential loss, any data loss or data corruption). If the law prohibits this exclusion, Kalkine Pty Ltd hereby limits its liability, to the extent permitted by law to the resupply of services. There may be a product disclosure statement or other offer document for the securities and financial products we write about in Kalkine Reports. You should obtain a copy of the product disclosure statement or offer document before making any decision about whether to acquire the security or product. The link to our Terms & Conditions has been provided please go through them and also have a read of the Financial Services Guide. On the date of publishing this report (mentioned on the website), employees and/or associates of Kalkine Pty Ltd do not hold positions in any of the stocks covered on the website. These stocks can change any time and readers of the reports should not consider these stocks as personalised advice.
 Please wait processing your request...