Kalkine has a fully transformed New Avatar.

Company Overview: Aurelia Metals Limited is an exploration and mineral development company. The Company operates through segments, including Hera-Nymagee project and other exploration projects. The Hera-Nymagee project includes the gold and base metal Hera deposit, and the copper discovery at the Nymagee copper deposit. The Hera-Nymagee Project is located approximately 100 kilometers southeast of Cobar in western New South Wales (NSW). The Hera Project produces gold-silver dore and a bulk concentrate, which includes lead and zinc. The Doradilla project is a tin project. The Company is also engaged in exploration for copper, gold and tin on a number of tenements in the Lachlan Fold Belt of NSW. The Doradilla Project represents an exploration target for nickel, copper, silver, bismuth, zinc and indium. The Tallebung tin field is located over 70 kilometers north-west of Condoblin, NSW, and includes a series of alluvial and deep lead tin deposits, as well as tin-tungsten hard rock lodes.
.png)
AMI Details
Revenue for FY19 Increased By 19% On Previous Year: Aurelia Metals Limited (ASX: AMI) is involved in the gold, copper, lead and zinc production and mineral exploration from Hera and Peak mines. Its revenue is majorly derived from bullion and base metal sales. The Company aims to deliver an attractive high cash margin over long-life assets which requires a dual strategy of operational and exploration excellence. Looking at the historical performance over FY16 to FY19, total revenue of the company has grown with a compound annual growth rate (CAGR) growth of 47.51%, and the bottom-line grew at a CAGR of 48.92% in the same period. Total revenue improved from $91.9 Mn in FY16 to $295 Mn in FY19, and net profit improved from $10.9 Mn in FY16 to $36.0 Mn in FY19. Net cash inflows for FY19 stood at $37.4 Mn with no debt, an improvement of ~16.5% on the previous year. Company’s profitability margins, Return on Equity and current ratio stood better than the industry median for FY19. Moreover, the company declared its maiden dividend payment which shows company’s commitment towards generating a better return for its shareholders.
As a part of the operating strategy, the company intends to increase efficiencies in underground mining and mineral processing, combined with a focus on selectively mining high margin ore. To back the strategy, an investment in processing infrastructure worth $53 million is underway at Peak to increase its capacity to treat a variety of base metal ores at optimal throughput rates.
Going forward, the company is expected to produce 85-95k oz of gold at AISC of $1050-$1250/oz for FY20 lower than FY19, whereas production for other metals such as lead, zinc and copper is expected to improve for FY20.
.png)
AMI’s Production Overview (Source: Company Reports)
FY19 Key Highlights for the period ended June 30, 2019: Group’s gold production for the period was reported at 117,521 oz at All-In Sustaining Cost (AISC) of $1,045/oz, representing a 21% increase in production on the prior year but at a higher unit cost, as compared to gold production of 97,374 oz at AISC of $509 per oz. Production at Hera Mine and Peak Mine stood at 58,025 oz at an AISC/oz of $809/oz and 59,496 oz at an AISC/oz of $1,143/oz, respectively. Revenue for the period increased by 19% to $295 Mn, largely due to 13% increase in gold sales, a 152% increase in copper sales, a 39% increase in lead sales, offset by a 24% reduction in Zinc sales, as compared to revenue of $248.6 Mn in the previous year. Hera contributed $97.0 million of gold revenue (49% of total gold revenue) and Peak contributed $100.9 million of gold revenue (51% of total gold revenue). The company had around 4,400 oz of gold in dore and concentrate unsold at year end due to the timing of production versus sales.
As per commodity contribution, precious metals and base metals contributed around 70% and 30% in the total revenue. Base metal revenue for the period was reported at $92.3 Mn, which was derived from the sale of 3,832 t of copper, 15,801 t of lead and 8,321 t of zinc. Hera mine and Peak Mine contributed $35.8 Mn and $56.5 Mn of base metal revenue, respectively.
Total cost of sales for the period increased to $215 Mn, as compared to $136.1 Mn in the previous year, which was largely due to the inclusion of 12 months of operating costs and depreciation and amortization (D&A) from Peak mines. Total operating costs (before D&A) at Peak mine increased by 208% during the period.
EBITDA for the period reduced by 25% to $103.1 Mn, as compared to $136.7 Mn in the previous period.
Net profit after tax for the period decreased by 64% to $36 Mn, as compared to $99.1 Mn in the previous year. This was mainly due to a $63.6 Mn increase in site costs and a $15.3 Mn increase in D&A from the inclusion of a full year of costs from the Peak Mine; a $21.8 Mn increase in income tax expense, with the position changing from a $6.8 Mn tax benefit in the prior year to a tax expense of $15 Mn in the current year. The Board of Directors declared maiden fully franked dividend of 2.0 cents fully paid ordinary share, with record date and payment date on September 2, 2019 and October 2, 2019, respectively.
.png)
FY19 Key Performance Metrics (Source: Company Reports)
Net Cash Inflow for FY19 Increased By ~16.51% On Previous Year: Net cash inflow from operating activities for the period was reported at $106.8 Mn, a decrease of $45 Mn from the previous year. The reduction in operating cash flows was largely due to the result of the transition from extremely high margin Chronos production at Peak into more normalized production activities in the current year. The operating cash inflow included income tax payments of $17.3 Mn, as compared to income tax payment of $8.9 Mn for FY18. Net cash outflow from investing activities for the period was reported at $68.6 Mn, a $21.1 Mn decrease on the previous year, which included cash outflows associated with the Peak Mine acquisition. The key investing activities for FY19 comprised $37 Mn of sustaining mine and processing capital and $22 Mn of processing and discovery growth capital. Net cash outflow from financing activities for the period was reported at $0.8 Mn, a decrease of $29 Mn from prior year, reflecting the net proceeds of equity raisings associated with the Peak acquisition and the repayment of all debt facilities. Net cash inflows for the year amounted to $37.4 Mn, as compared to $32.1 Mn in the previous year.
.png)
FY19 Cashflow Metrics (Source: Company Reports)
Performance at Hera Mine: Despite a decrease in gold and base metal grades, the Hera mine performed strongly during the year. Gold production for the period was reported at 58,025 oz at AISC of $809/oz, compared to the prior year of 59,822 oz at ASIC of $430/oz. The increase in AISC can be attributed to the reduced gold head grade but also as a consequence of reduced by-product credits, from lower metal production and lower base metal prices. Hera’s future is a declining gold grade (subject to further exploration success) countered by increased lead and zinc grades. Operating costs are expected to continue to reduce along with a reduction in the amount of sustaining capital required.
.png)
FY19 Hera Mine Performance Metrics (Source: Company Reports)
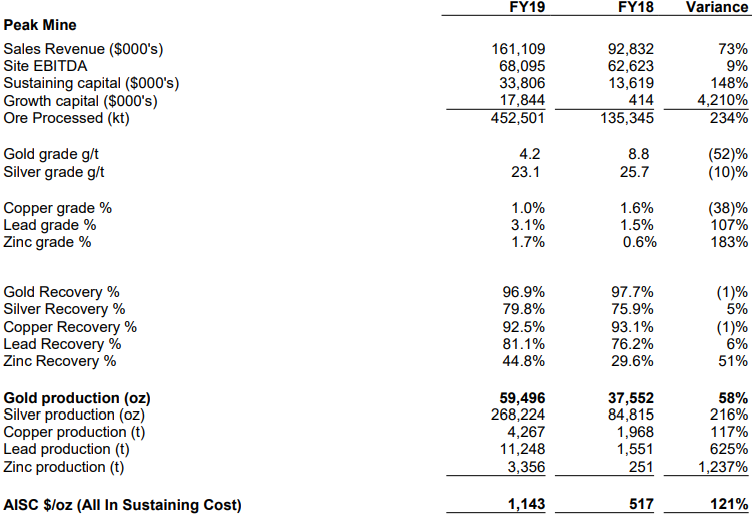
Performance at Peak Mine: Gold production at Peak mine for the period stood at 59,496 oz at AISC of $1,143/oz, as compared to the production of 37,552 oz at AISC of $517/oz in FY18.The increase in AISC can be attributed to a 52% decrease in gold head grades, with the transition during the year from the very high gold grade Chronos zone into lower gold, higher base metal Chronos mineralization. To capture the value of increased base metals now and in the future, the company is investing $53 Mn in a major upgrade of the lead and zinc capacity of the processing plant to enable the processing of high-grade base metals at throughput rates of up to 800,000 tpa. Commissioning of the new circuit is planned for the March 2020 quarter, following which a shift to increased lead and zinc production is planned for the second half of next financial year.
Top 10 Shareholders: The top 10 shareholders have been highlighted in the table, which together form around 42.22% of the total shareholding. Mitsubishi UFJ Financial Group Inc and Colonial First State Global Asset Management hold maximum interest in the company at 7.96% and 6.11%, respectively. In the previous month, company’s substantial stake holder AustralianSuper Pty Ltd reduced its stake from 7.49% to 6.06% in the company, effective from September 5, 2019.
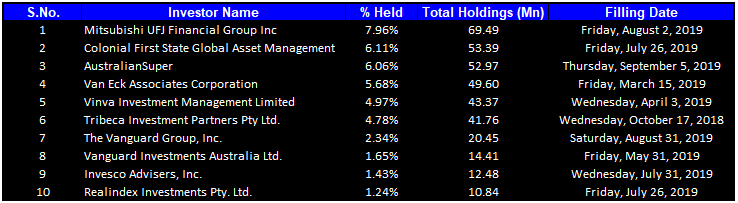
Top 10 Shareholders (Source: Thomson Reuters)
A Quick Look at Key Metrics: Its EBITDA margin and net margin for FY19 stood at 40.9% and 12.2%, better than the industry median of 29.1% and 11.0%, respectively, which implies decent fundamentals for the company. Its current ratio for FY19 stood at 2.63x, better than the industry median of 1.75x, which implies that the company is in a better position to address its short-term obligations. Its ROE for FY19 stood at 17.8%, better the industry median of 12.3%, which implies that the company generated a better return for its shareholders than its peer group.
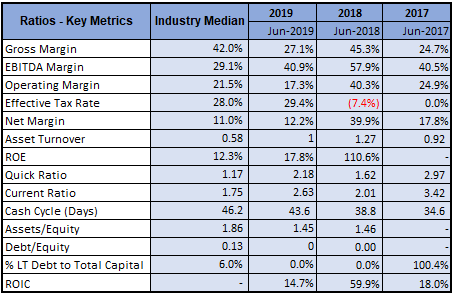
Key Metrics (Source: Thomson Reuters)
Key Updates: On September 4, 2019, the company provided an update to the market about its current exploration activities in the Kairos area at the Peak Mine and at the Federation and Main Southeast areas near the Hera Mine. At Kairos Area (previously known as Peak Deeps), new zone of strong copper mineralization identified in drilling ~150 metres. Additionally, high-grade base metal and gold intercept encountered in the lower Kairos area. At the federation prospect south of Hera, further strong mineralization intercepted in the follow-up drilling process. Moreover, broad zones of shallow oxide gold mineralization also intercepted in RC (Reverse Circulation) drilling at Federation. Company is firmly focused on investing in the life and margin of its existing assets, to support economic potential within the large-scale mineralized system.
Key Risks: The company is exposed to certain risks such as business risks which include fluctuations in the commodity prices, wrong estimation in the Ore Reserves and Resources, mining risks, insurance risks, production & cost estimation, etc.
What to Expect: As per the report, Group gold production for FY20 is expected to be 85 to 95koz (lower than the FY19 actual production of 118 koz) at an All-In-Sustaining-Cost (AISC) estimated at A$1,050 to A$1,250/oz. Production for other base metals is expected to increase in FY20 in comparison to FY19.
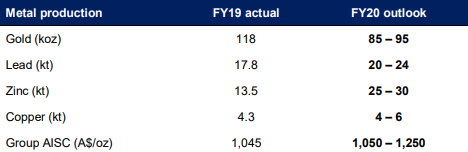
FY20 Production and AISC Guidance (Source: Company Reports)
Gold Production at Hera and Peak: Hera gold production for FY20 is expected to be 33 to 36koz. FY20 All-In Sustaining costs (AISC) at Hera is expected to be lower than FY19. This is due to the lower gold grade forecast to be offset by lower operating costs and higher expected base metal credits as compared to FY19.
Peak gold production for FY20 is expected to be 52 to 59koz. FY20 All-In Sustaining costs (AISC) at Peak is expected to be higher than FY19. This is due to the lower expected gold grade relative to FY19. The unit operating costs are expected to improve because of the increase in operating underground development meters in FY20, which is five times the level undertaken in FY19.
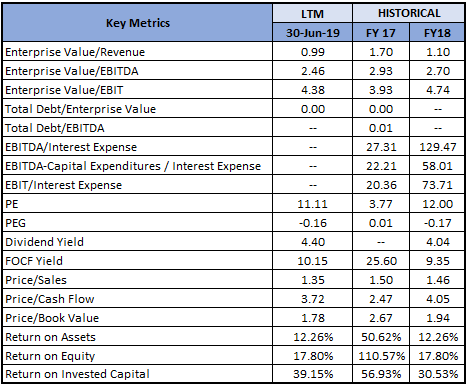
Key Valuation Metrics (Source: Thomson Reuters)
Valuation Methodology 1: Price to Cash Flow Multiple Approach (NTM):
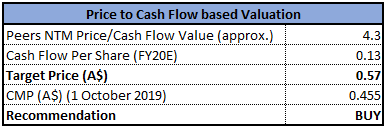
Price to Cash Flow Multiple Approach (Source: Thomson Reuters), *NTM-Next Twelve Months
Valuation Methodology 2: EV/Sales Multiple Approach (NTM):
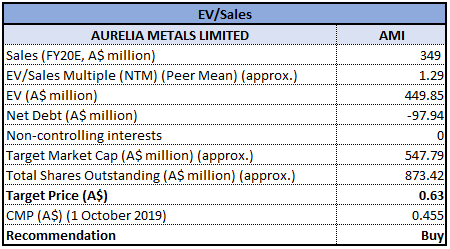
EV/Sales Multiple Approach (Source: Thomson Reuters), *NTM-Next Twelve Months
Note: All forecasted figures and peers have been taken from Thomson Reuters, *NTM-Next Twelve Months
Stock Recommendation: AMI’s stock generated a negative YTD return of 32.59%. Currently, the stock is trading close to its 52-week low levels of $0.390 with reasonable PE multiple of 10.94x and annual dividend yield of 4.4%, indicating a decent opportunity for accumulation. The group delivered decent top-line performance in FY19, good profitability margin and Return on Equity. The company is net cash positive along with no debt, which is an indication that the company is utilizing its own funds to fuel its operations. Looking at the business prospects over the long-term, we have valued the stock using two relative valuation methods, i.e., Price to Cash Flow and Enterprise Value to Sales multiples, and arrived at a target price of double-digit growth (in % term). Hence, we give a “Buy” recommendation on the stock at the current market price of A$0.455 per share.
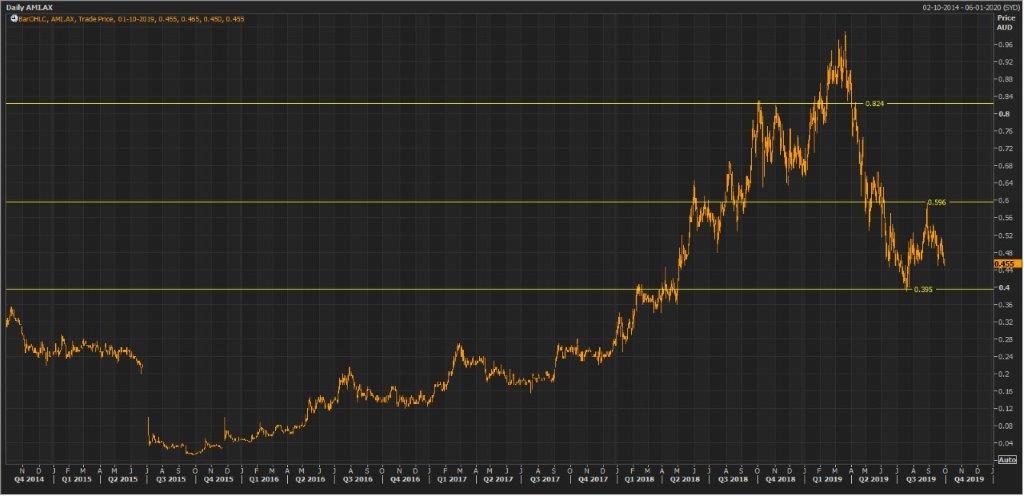
AMI Daily Technical Chart (Source: Thomson Reuters)
Disclaimer
The advice given by Kalkine Pty Ltd and provided on this website is general information only and it does not take into account your investment objectives, financial situation or needs. You should therefore consider whether the advice is appropriate to your investment objectives, financial situation and needs before acting upon it. You should seek advice from a financial adviser, stockbroker or other professional (including taxation and legal advice) as necessary before acting on any advice. Not all investments are appropriate for all people. Kalkine.com.au and associated pages are published by Kalkine Pty Ltd ABN 34 154 808 312 (Australian Financial Services License Number 425376). The information on this website has been prepared from a wide variety of sources, which Kalkine Pty Ltd, to the best of its knowledge and belief, considers accurate. You should make your own enquiries about any investments and we strongly suggest you seek advice before acting upon any recommendation. Kalkine Pty Ltd has made every effort to ensure the reliability of information contained in its newsletters and websites. All information represents our views at the date of publication and may change without notice. To the extent permitted by law, Kalkine Pty Ltd excludes all liability for any loss or damage arising from the use of this website and any information published (including any indirect or consequential loss, any data loss or data corruption). If the law prohibits this exclusion, Kalkine Pty Ltd hereby limits its liability, to the extent permitted by law to the resupply of services. There may be a product disclosure statement or other offer document for the securities and financial products we write about in Kalkine Reports. You should obtain a copy of the product disclosure statement or offer document before making any decision about whether to acquire the security or product. The link to our Terms & Conditions has been provided please go through them and also have a read of the Financial Services Guide. On the date of publishing this report (mentioned on the website), employees and/or associates of Kalkine Pty Ltd do not hold positions in any of the stocks covered on the website. These stocks can change any time and readers of the reports should not consider these stocks as personalised advice.
 Please wait processing your request...