Kalkine has a fully transformed New Avatar.

Company Overview: Aurelia Metals Limited is an exploration and mineral development company. The Company operates through segments, including Hera-Nymagee project and other exploration projects. The Hera-Nymagee project includes the gold and base metal Hera deposit, and the copper discovery at the Nymagee copper deposit. The Hera-Nymagee Project is located approximately 100 kilometers southeast of Cobar in western New South Wales (NSW). The Hera Project produces gold-silver dore and a bulk concentrate, which includes lead and zinc. The Doradilla project is a tin project. The Company is also engaged in exploration for copper, gold and tin on a number of tenements in the Lachlan Fold Belt of NSW. The Doradilla Project represents an exploration target for nickel, copper, silver, bismuth, zinc and indium. The Tallebung tin field is located over 70 kilometers north-west of Condoblin, NSW, and includes a series of alluvial and deep lead tin deposits, as well as tin-tungsten hard rock lodes.
.png)
AMI Details
Cash Balance for Sep’19 Qtr Stood at $93 Mn with No Debt: Aurelia Metals Limited (ASX: AMI) derives its revenue from the production, exploration, and sale from bullion and base metals such as gold, copper, lead and zinc. The company operates two important mines i.e., Hera and Peak. It aims to deliver an attractive high cash margin over long-life assets, which requires a dual strategy of operational and exploration excellence. Looking at the past performance over FY16 to FY19, total revenue of the company has grown with a compound annual growth rate (CAGR) of 47.51%, and the bottom-line grew at a CAGR of 48.92% over the same period. Total revenue improved from $91.9 Mn in FY16 to $295 Mn in FY19, and net profit improved from $10.9 Mn in FY16 to $36.0 Mn in FY19. Net cash inflows for FY19 stood at $37.4 Mn with no debt, an improvement of ~16.5% on the previous year. Company’s profitability margins, Return on Equity and current ratio stood better than the industry median for FY19. Moreover, the company declared its maiden dividend payment, which shows the company’s commitment towards generating better returns for its shareholders.
Going forward, the company is expected to produce 85-95k oz of gold at AISC of $1050-$1250/oz for FY20, lower than FY19. Production for other metals such as lead, zinc and copper are expected to improve for FY20. September 2019 quarter benefited from grade and throughput increases at Peak. There are major investments in the second half of CY19 for Peak plant upgrade, accelerating Underground (UG) development and access to Kairos (Peak Deeps), which are expected to help the company in delivering a sustainable return for its customers and shareholders. It reported a cash balance of ~$93 Mn, with no debt at the end of September’19 quarter.
.png)
Quarterly Production Metrics (Source: Company Reports)
September’19 Quarter Key Highlights: Group Sales revenue for the period was reported at $92 Mn, where the contribution from precious metals stood at 73% and rest from the sales of copper, lead and zinc. Total gold dore and gold in concentrate sold in the period were reported at 30,747 oz, as compared to 19,583 oz in the previous quarter.
Net site cash flow (before corporate costs, discovery and growth capital expenditure) for the period was reported at $37 Mn, wherein contribution from Peak and Hera stood at $25 Mn and $12 Mn, respectively. The combined site contribution for the period was reported at $19 Mn, where discovery spends stood at $2 Mn and growth capital at $16 Mn.
Cash in bank at the end of the period was reported at $93.1 Mn, reduced by $11.2 Mn from the previous quarter. The company, at the end of the quarter, had no debt on the balance sheet. The decline in the cash balance on the balance sheet can be attributed to corporate capital and administration costs of $2 Mn, tax payments of $6 Mn, realised losses on gold forwards of $9 Mn and changes in working capital of $13 Mn outflow, largely associated with reduction in creditors and a buildup in finished concentrate inventory.
The dividend payment of $17 Mn on October 2, 2019 and the continued high levels of spend on growth capital, especially on upgradation of Pb/Zn plant, are expected to further reduce cash balance in the next quarter. However, the impact of reduced capital spend and increased production are expected to positively impact the cash flows in the second half of the financial year 2020.
Capital spend for the period stood at $28 Mn where spend on Hera mine and Peak mine stood at $5 Mn and $23 Mn, respectively. This spend mostly comprised $10 Mn of sustaining capital, growth capital of $16 Mn and discovery spend of $2 Mn. Plant upgrade at Peak was worth expenditure of $15 Mn. Company’s hedge book as on September 30, 2019, was reported at 35 koz at $1,854/oz as compared to 56 koz at $1,809/oz as on June 30, 2019.
The company declared a maiden fully franked dividend of 2 cents per share, reflecting around 50% of net profit and net cash generation in FY19.
.png)
September’19 Key Financial Metrics (Source: Company Reports)
Higher Gold Production at Peak offsets Lower Production at Hera: Group’s quarterly gold production for the September quarter increased to 29,307 oz as compared to 22,864 oz in the previous quarter. Gold production at Peak mine stood at 18,772 oz at All-In Sustaining cost (AISC) of $ 764 per oz. Production at Peak mine significantly improved based on increased grade from the processing of high-grade Chronos ore and increased throughput. Concentrate stocks increased at quarter-end with increased shipments in the December quarter expected to reduce inventory levels. Base metal production during the quarter was 1,590 tonnes of copper in concentrate, 4,601 tonnes of lead in concentrate and 1,803 tonnes of zinc in concentrate. Peak maintained a relatively high level of concentrate stocks (particularly copper) at the end of September, with stock levels expected to reduce in the December quarter.
Gold production at Hera mine stood at 10,535 oz at AISC of $1,149 per oz. Production at Hera mine was impacted by reduced throughput, mainly driven by increased base metal grades and increased processing costs. Significant increase in processing cost for the quarter can be attributed to repairs to the process water dam; concentrate re-handling; increase in maintenance shut time in July; and water haulage.
.png)
September’19 Quarter Key Operational Metrics (Source: Company Reports)
FY19 Key Financial Highlights: Revenue from ordinary activities for the period increased by 19% to $295,002,000, mainly due to 13% increase in gold sales, a 152% increase in copper sales, a 39% increase in lead sales, offset by a 24% reduction in zinc sales. Net Profit after Income Tax for the period decreased by 64% to $36,017,000, mainly due to $63.6 Mn increase in site costs; $15.3 Mn increase in D&A; and a $21.8 Mn increase in Income Tax expense.
.png)
FY19 Key Metrics (Source: Company Reports)
Top 10 Shareholders: The top 10 shareholders have been highlighted in the table, which together form around 34.91% of the total shareholding. AustralianSuper and Van Eck Associates Corporation hold maximum interest in the company at 6.06% and 5.68%, respectively.
.png)
Top 10 Shareholders (Source: Thomson Reuters)
A Quick Look at Key Metrics: EBITDA margin and net margin for FY19 stood at 40.9% and 12.2%, better than the industry median of 29.1% and 11.0%, respectively, which implies decent fundamentals for the company. Its current ratio for FY19 stood at 2.63x, better than the industry median of 1.75x, which implies that the company is in a better position to address its short-term obligations. Its ROE for FY19 stood at 17.8%, better than the industry median of 12.3%, which implies that the company generated a better return for its shareholders than its peer group.
.png)
Key Metrics (Source: Thomson Reuters)
Recent Updates:
During the September’19 Quarter, the company appointed Dan Clifford as Managing Director and CEO, effective from November 25, 2019. Mr. Clifford has more than 25 years of experience in the mining industry and has worked with Glencore, Anglo Coal, BHP Billiton and Solid Energy. Recently, Mr. Clifford served Stanmore Coal Limited, as Managing Director. The company also appointed Peter Trout as Chief Operating Officer (COO), effective from late November 2019. He has experience of 25 years in technical, operational and executive roles, with important companies such as PanAust, Caledon Coal, Perilya, Newcrest and Mt Isa Mines.
Key Risks: The company is exposed to certain risks such as business risks, which include fluctuations in the commodity prices, wrong estimation in the Ore Reserves and Resources, mining risks, insurance risks, production & cost estimation, etc.
What to Expect: Full-year production guidance has been set at 85-95 koz at All-In Sustaining Costs of $1,050-1,250/oz, based on 2019 reserves metal price deck. The December’19 quarter is expected to be particularly weak due to lower forecast grades and construction activities associated with the Peak plant upgrade.
Drought conditions in central New South Wales (NSW) are impacting the sites. The Company plans to mitigate this risk by utilising water from historic workings (Great Cobar at Peak and Nymagee at Hera) and locating additional ground bore water sources, to ensure water self-sufficiency at the sites.
On September 4, 2019, the company announced the intercept of a new zone of strong copper mineralization around 150 metres, below the current Kairos Resource. Moreover, the Pb/Zn Plant Upgrade is expected to enable the Peak processing plant to operate at up to 800,000 tpa on high-grade base metal feed, unlocking the value of the Chronos and Kairos lead/zinc resources. June 2020 quarter should benefit from the expected strong lift in Peak throughput, following targeted plant upgrade completion in March 2020 quarter.
FY20 gold production for Peak Mine has been estimated at 52 – 59koz, with AISC to be higher than FY19. Gold production for Hera Mine has been estimated at 33 – 36koz, with AISC to be lower than FY19.
.png)
FY20 Production and AISC Guidance (Source: Company Reports)
.png)
Key Valuation Metrics (Source: Thomson Reuters)
Valuation Methodology 1: Price to Earnings (PE) Multiple Approach (NTM):
.png)
Price to Earnings (PE) Multiple Approach (Source: Thomson Reuters), *NTM-Next Twelve Months
Valuation Methodology 2: EV/EBITDA Multiple Approach (NTM):
.png)
EV/EBITDA Multiple Approach (Source: Thomson Reuters), *NTM-Next Twelve Months
Note: All forecasted figures and peers have been taken from Thomson Reuters, *NTM-Next Twelve Months
Stock Recommendation: The stock price fell by 38.36% and 33.33% in the past six months and Year-to-Date, respectively. Company’s decent historical compounded annual growth rate for both top-line and bottom-line, increase in production for September’19 quarter, enough cash balance with no debt, decent profitability margins, ongoing projects, etc., are expected to prove as headwinds in the coming times. Annual throughput at Peak in FY21 is expected to reach to a nameplate capacity of 800 ktpa. Growth capital expenditure in FY21 is expected to reduce sharply, following the expected completion of the Peak Pb/Zn upgrade in Q3FY20. Looking at the business prospects over the long-term, we have valued the stock using two relative valuation methods, i.e., Price to Earnings (PE) and Enterprise Value to EBITDA multiples, and arrived at a target price of double-digit growth (in % term). Hence, we give a “Buy” recommendation on the stock at the current market price of A$0.460 per share, up 2.222% on October 29, 2019.
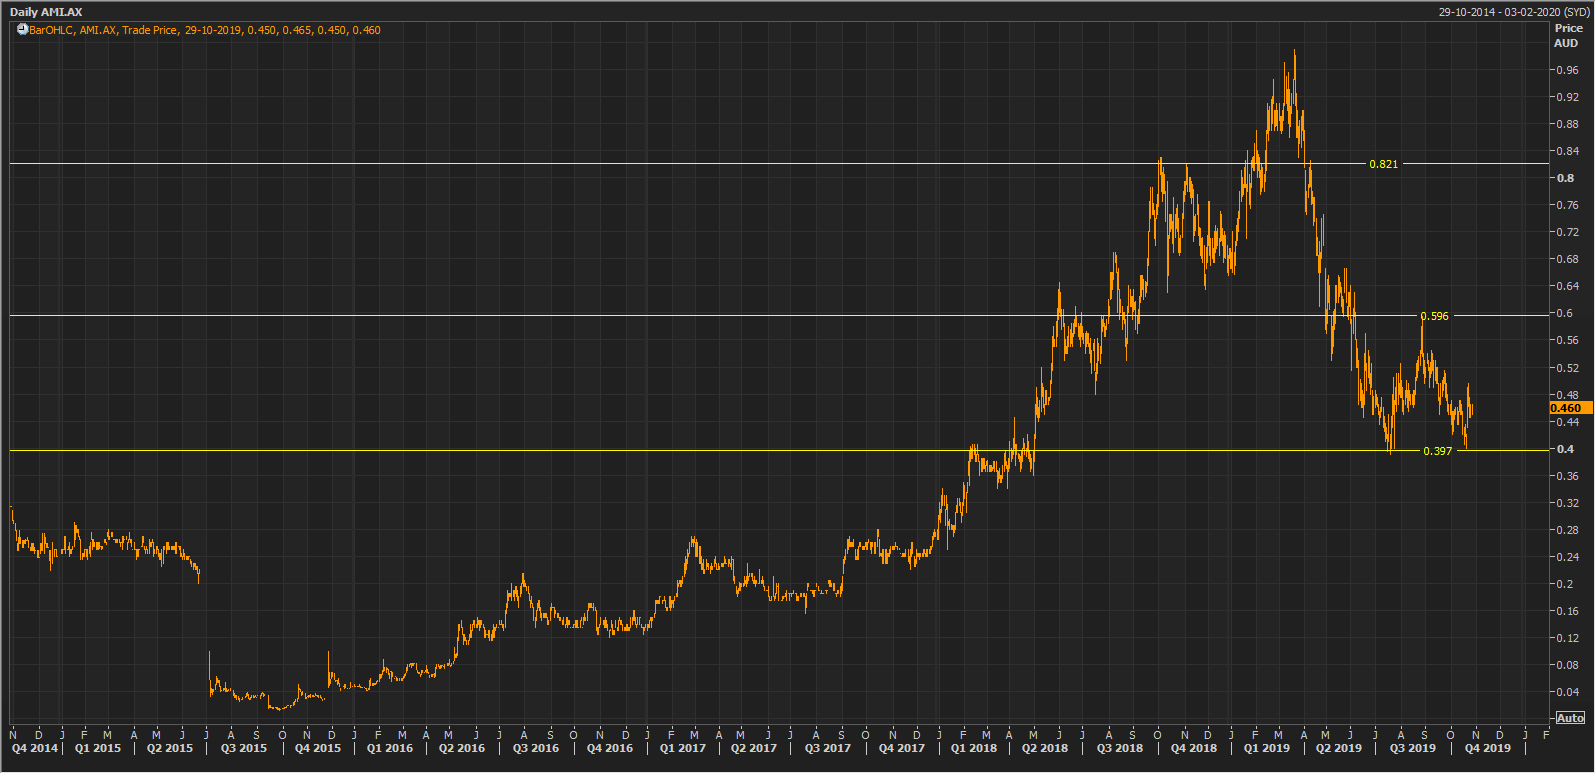
AMI Daily Technical Chart (Source: Thomson Reuters)
Disclaimer
The advice given by Kalkine Pty Ltd and provided on this website is general information only and it does not take into account your investment objectives, financial situation or needs. You should therefore consider whether the advice is appropriate to your investment objectives, financial situation and needs before acting upon it. You should seek advice from a financial adviser, stockbroker or other professional (including taxation and legal advice) as necessary before acting on any advice. Not all investments are appropriate for all people. Kalkine.com.au and associated pages are published by Kalkine Pty Ltd ABN 34 154 808 312 (Australian Financial Services License Number 425376). The information on this website has been prepared from a wide variety of sources, which Kalkine Pty Ltd, to the best of its knowledge and belief, considers accurate. You should make your own enquiries about any investments and we strongly suggest you seek advice before acting upon any recommendation. Kalkine Pty Ltd has made every effort to ensure the reliability of information contained in its newsletters and websites. All information represents our views at the date of publication and may change without notice. To the extent permitted by law, Kalkine Pty Ltd excludes all liability for any loss or damage arising from the use of this website and any information published (including any indirect or consequential loss, any data loss or data corruption). If the law prohibits this exclusion, Kalkine Pty Ltd hereby limits its liability, to the extent permitted by law to the resupply of services. There may be a product disclosure statement or other offer document for the securities and financial products we write about in Kalkine Reports. You should obtain a copy of the product disclosure statement or offer document before making any decision about whether to acquire the security or product. The link to our Terms & Conditions has been provided please go through them and also have a read of the Financial Services Guide. On the date of publishing this report (mentioned on the website), employees and/or associates of Kalkine Pty Ltd do not hold positions in any of the stocks covered on the website. These stocks can change any time and readers of the reports should not consider these stocks as personalised advice.
 Please wait processing your request...