Kalkine has a fully transformed New Avatar.

Company Overview: Aurelia Metals Limited is an exploration and mineral development company. The Company operates through segments, including Hera-Nymagee project and other exploration projects. The Hera-Nymagee project includes the gold and base metal Hera deposit, and the copper discovery at the Nymagee copper deposit. The Hera-Nymagee Project is located approximately 100 kilometers southeast of Cobar in western New South Wales (NSW). The Hera Project produces gold-silver dore and a bulk concentrate, which includes lead and zinc. The Doradilla project is a tin project. The Company is also engaged in exploration for copper, gold and tin on a number of tenements in the Lachlan Fold Belt of NSW. The Doradilla Project represents an exploration target for nickel, copper, silver, bismuth, zinc and indium. The Tallebung tin field is located over 70 kilometers north-west of Condoblin, NSW, and includes a series of alluvial and deep lead tin deposits, as well as tin-tungsten hard rock lodes.
.png)
AMI Details
Investors Cheer over Maiden Dividend Payment by AMI Board: Aurelia Metals Limited (ASX: AMI) derives its revenue from the production, exploration, and sale from bullion and base metals such as gold, copper, lead and zinc. The company operates two important mines, i.e., Hera and Peak. It aims to deliver an attractive high cash margin over long-life assets, which requires a dual strategy of operational and exploration excellence. Looking at the past performance over FY16 to FY19, total revenue of the company has grown with a compound annual growth rate (CAGR) of 47.51%, and the bottom-line grew at a CAGR of 48.92% over the same period. Total revenue improved from $91.9 Mn in FY16 to $295 Mn in FY19, and net profit improved from $10.9 Mn in FY16 to $36.0 Mn in FY19. The year 2018 witnessed a significant consolidation, following the remarkable acquisition of Peak Mines.
FY19 was proved a successful year as the company continued to deliver decent operational performance, wherein EBITDA and Net Operating Cashflow surpassed A$100 million for the second consecutive year. Company’s profitability margins, Return on Equity and current ratio stood better than the industry median for FY19. Moreover, the company declared its maiden dividend payment, which shows the company’s commitment towards generating better returns for its shareholders. As an exploration and drilling success in FY19, AMI’s discoveries included the Federation and Athena systems in Hera, and the Kairos and Upper Chronos extensions in the Peak near-mine area.
Production for September 2019 quarter benefited from the increase in grade and throughput at Peak. There are major investments in the second half of CY19 for Peak plant upgrade, accelerating Underground (UG) development and access to Kairos (Peak Deeps), which are expected to help the company in delivering a sustainable return for its customers and shareholders. It reported a cash balance of ~$93 Mn, with no debt at the end of September’19 quarter.
Company is focusing on investing heavily for a major upgrade at the processing circuit at Peak Mines. With the completion and commissioning of this plant in first-half of CY20, lead-zinc production capacity is expected to increase multifold. Its investments in high grade Kairos deposits will allow the company to reap benefit from the availability of additional high margin ore sources in the coming years.
.png)
AMI’s Past Historical Performance (Source: Company Reports)
September’19 Quarter Key Financial Highlights: Group Sales revenue for the period was reported at $92 Mn, where the contribution from precious metals stood at 73% and rest from the sales of copper, lead and zinc. Total gold ore and gold in concentrate sold in the period were reported at 30,747 oz as compared to 19,583 oz in the previous quarter.
Net site cash flow (before corporate costs, discovery and growth capital expenditure) for the period was reported at $37 Mn, wherein contribution from Peak and Hera stood at $25 Mn and $12 Mn, respectively. The combined site contribution for the period was reported at $19 Mn, where discovery spends stood at $2 Mn and growth capital at $16 Mn.
Cash in bank at the end of the period was reported at $93.1 Mn, reduced by $11.2 Mn from the previous quarter. The company, at the end of the quarter, had no debt on the balance sheet. The decline in the cash balance on the balance sheet can be attributed to corporate capital and administration costs of $2 Mn, tax payments of $6 Mn, realized losses on gold forwards of $9 Mn and changes in working capital of $13 Mn outflow, largely associated with reduction in creditors and a buildup in finished concentrate inventory.
The dividend payment of $17 Mn on October 2, 2019 and continued high levels of spending on growth capital, especially on upgradation of Pb/Zn plant, are expected to further reduce cash balance in the next quarter. However, the impact of reduced capital spend and increased production are expected to positively impact the cash flows in the second half of the financial year 2020.
The company declared a maiden fully franked dividend of 2 cents per share, reflecting around 50% of net profit and net cash generation in FY19..png)
September’19 Quarter Financial Performance (Source: Company Reports)
September’19 Key Production Highlights: Group’s gold production improved from 22,864 oz in June Quarter to 29,307 oz in September Quarter. The All-In Sustaining Cost (AISC) for the period was reported at $988 per oz. Production at Peak Mine and Hera Mine stood at 18,772 oz at AISC of $764/oz and 10,535 oz at AISC of $1,149/oz, respectively.
Capital spend for the period stood at $28 Mn where spend on Hera mine and Peak mine stood at $5 Mn and $23 Mn, respectively. This spend mostly comprised $10 Mn of sustaining capital, growth capital of $16 Mn and discovery spend of $2 Mn. Plant upgrade at Peak was worth expenditure of $15 Mn. Company’s hedge book as on September 30, 2019 was reported at 35 koz at $1,854/oz as compared to 56 koz at $1,809/oz as on June 30, 2019..png)
September’19 Key Production Metrics (Source: Company Reports)
Gold Hedging: Company’s gold hedge position as on September 30, 2019 was reported at 35,000 oz, with an average price of $1,854 per oz as compared to 56,000 oz with an average price of $1,736 per oz in the prior quarter. Cash outflow reported at $9 Mn, after the delivery of 21,000 oz with an average price of $1,736 per oz in comparison to spot price of $2,160 per oz..png)
Future quarterly deliveries and average prices Data (Source: Company Reports)
Recent Update:
On December 4, 2019, the company updated on its strategy to achieve access to reliable water sources to support activities at the Peak Mines near Cobar in New South Wales. The Peak has now received work approval from the Natural Resources Access Regulator, which will now lead to the initiation of the final two outstanding administrative approvals. Following the reception of these approvals, the pumping of groundwater from the Great Cobar Mine to Peak will commence. Reverse Osmosis treatment equipment is being sourced to manage the water quality risk.
In another update, the company appointed Peter Trout as Chief Operating Officer (COO) and Dan Clifford as Managing Director and Chief Executive Officer (CEO). Mr. Trout has an experience of 25 years in technical, operational and executive roles in the mining industry. Mr. Clifford has an experience of 25 years in the mining industry in various markets such as Australia, South Africa and New Zealand.
Top 10 Shareholders: The top 10 shareholders have been highlighted in the table, which together form around 25.48% of the total shareholding. AustralianSuper and Van Eck Associates Corporation hold maximum interest in the company at 6.06% and 5.68%, respectively..png)
Top 10 Shareholders (Source: Thomson Reuters)
A Quick Look at Key Metrics: EBITDA margin and net margin for FY19 stood at 40.9% and 12.2%, better than the industry median of 28.7% and 10.9%, respectively, which implies decent fundamentals for the company. Its current ratio for FY19 stood at 2.63x, better than the industry median of 1.81x, which implies that the company is in a better position to address its short-term obligations. Its ROE for FY19 stood at 17.8%, better than the industry median of 12.0%, which implies that the company generated a better return for its shareholders than its peer group. Its cash cycle for FY19 stood at 43.60 days, lower than the industry median of 46.60 days, which implies that the company efficiently managed its asset-liability balances..png)
Key Metrics (Source: Thomson Reuters)
Key Risks: The company is exposed to certain risks such as business risks, which include fluctuations in the commodity prices, wrong estimation in the Ore Reserves and Resources, mining risks, insurance risks, production & cost estimation, etc.
What to Expect: Full-year production guidance has been set at 85-95 koz at All-In Sustaining Costs of $1,050-1,250/oz, based on 2019 reserves metal price deck. The December’19 quarter is expected to be particularly weak due to lower forecast grades and construction activities associated with the Peak plant upgrade. FY20 gold production for Peak Mine has been estimated at 52 – 59koz, with AISC to be higher than FY19. Gold production for Hera Mine has been estimated at 33 – 36koz, with AISC to be lower than FY19.
Growth Capital of around A$40 Mn strongly weighs towards the first half of FY20, especially in the Pb/Zn plant upgrade at Peak. Sustaining capital, mainly associated with Peak mine development has been estimated at A$45-50 Mn. The exploration budget for FY20 has been kept at A$15 Mn. Under the company’s hedging strategy, 56koz of gold have been hedged at an average price of A$1,809/oz for FY20, where 35koz of gold were hedged at an average price of A$1,748/oz to Nov 2019 and 21koz of gold would be hedged at an average price of A$1,911/oz over remaining months to Jun 2020..png)
FY20 Guidance (Source: Company Reports)
Gold Outlook: Gold Spot (XAU/USD) at the time of writing was trading at US$1477.13 (December 17, 2019, 16:34 (UTC+11)). It made its 52-week high of US$1557.25 as on September 4, 2019, and since then, the gold market has consolidated in the band range of US$1445.00 – US$1557. Breaking the upper side of the band will lead to a fresh upside rally, whereas crossing the lower band will lead to a downward movement.
The macro-economic concerns, especially the fear for re-escalation of trade-war between US and China has cautioned the global investors. With this, the yellow metal continues to be an investment destination for concerned investors as a hedging tool. An increase in oil prices after the drone attack on Saudi Aramco’s operations in Saudi Arabia, is also a major cause of concern for the investor’s community, leading to the distribution of investment exposure in the gold..png)
Gold Spot (XAU/USD) (Source: Thomson Reuters).png)
Key Valuation Metrics (Source: Thomson Reuters)
Valuation Methodology: Price to Earnings (PE) Multiple Approach: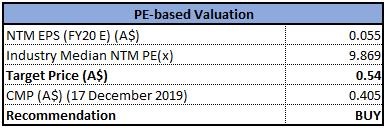
Price to Earnings (PE) Multiple Approach (Source: Thomson Reuters)
Note: All forecasted figures and peers have been taken from Thomson Reuters, *NTM-Next Twelve Months
Stock Recommendation: The stock price fell by 14.74% and 40.00% in the past six months and Year-to-Date, respectively. Company’s annual throughput at Peak in FY21 is expected to be tending close to a nameplate capacity of 800ktpa. Accelerated underground (UG) development work has been anticipated to deliver access to a base of Kairos by the end of FY20, underpinned by the strong potential for mining of high margin tonnes from Kairos in FY21. Following the completion of the Peak Pb/Zn upgrade in the third quarter of FY20, growth capital expenditure in FY21 is expected to decline sharply. On the technical analysis front, the stock is trading above a strong support level of $0.393 over weekly time framework chart. Moreover, the relative strength index for 14 weeks is at the level of 37.2557, stating oversold position.
Considering company’s decent historical compounded annual growth rate for both top-line and bottom-line, increase in production for September’19 quarter, enough cash balance with no debt, decent profitability margins, ongoing projects and gold outlook, we have valued the stock using a relative valuation method, i.e., Price to Earnings (PE) multiple, and arrived at a target price of lower double-digit growth (in % term). Hence, we give a “Buy” recommendation on the stock at the current market price of A$0.405 per share on December 17, 2019.
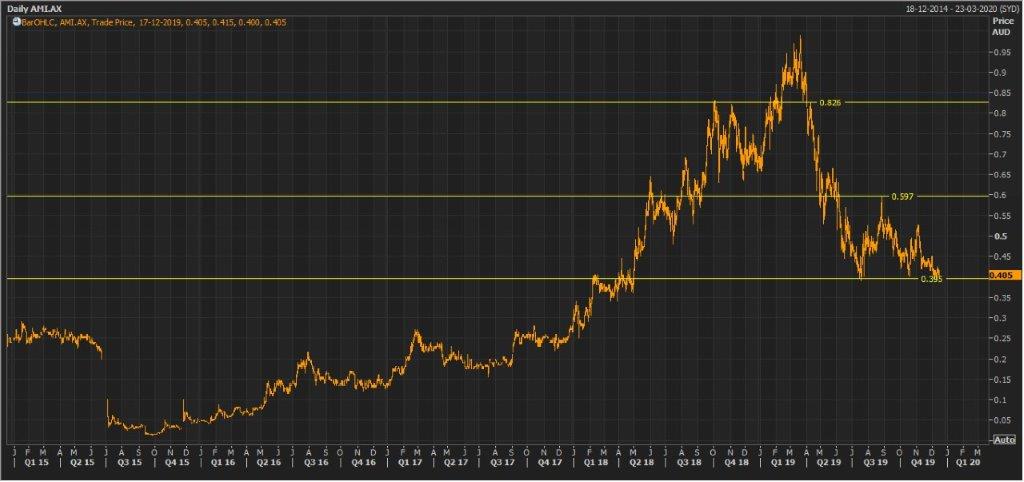
AMI Daily Technical Chart (Source: Thomson Reuters)
Disclaimer
The advice given by Kalkine Pty Ltd and provided on this website is general information only and it does not take into account your investment objectives, financial situation or needs. You should therefore consider whether the advice is appropriate to your investment objectives, financial situation and needs before acting upon it. You should seek advice from a financial adviser, stockbroker or other professional (including taxation and legal advice) as necessary before acting on any advice. Not all investments are appropriate for all people. Kalkine.com.au and associated pages are published by Kalkine Pty Ltd ABN 34 154 808 312 (Australian Financial Services License Number 425376). The information on this website has been prepared from a wide variety of sources, which Kalkine Pty Ltd, to the best of its knowledge and belief, considers accurate. You should make your own enquiries about any investments and we strongly suggest you seek advice before acting upon any recommendation. Kalkine Pty Ltd has made every effort to ensure the reliability of information contained in its newsletters and websites. All information represents our views at the date of publication and may change without notice. To the extent permitted by law, Kalkine Pty Ltd excludes all liability for any loss or damage arising from the use of this website and any information published (including any indirect or consequential loss, any data loss or data corruption). If the law prohibits this exclusion, Kalkine Pty Ltd hereby limits its liability, to the extent permitted by law to the resupply of services. There may be a product disclosure statement or other offer document for the securities and financial products we write about in Kalkine Reports. You should obtain a copy of the product disclosure statement or offer document before making any decision about whether to acquire the security or product. The link to our Terms & Conditions has been provided please go through them and also have a read of the Financial Services Guide. On the date of publishing this report (mentioned on the website), employees and/or associates of Kalkine Pty Ltd do not hold positions in any of the stocks covered on the website. These stocks can change any time and readers of the reports should not consider these stocks as personalised advice.
 Please wait processing your request...