Kalkine has a fully transformed New Avatar.

Company Overview: Charter Hall Group (ASX: CHC) is an integrated property group involved in accessing equity from listed, wholesale and retail investors and then creating value through attractive investment opportunities. CHC manages and invests equity across office, retail, industrial and logistics and social infrastructure and has a strong experience in property investment and funds management, as it has carefully curated a $38.9 billion plus diverse portfolio of over 1100 high quality, long leased properties. CHC’s ability to partner with capital to access attractive investment opportunities and its willingness and ability to invest alongside its partners has made it an active market participant, particularly, where it can access high quality assets leased to quality tenants on long weighted average leases..png)
CHC Details
.png)
Strong History of Managing Unlisted Property Funds and Syndicates: Charter Hall Group (ASX: CHC) is Australia’s leading fully integrated property group with strong experience in property investment and funds management. The company’s strategy is to use its property expertise to access, deploy, manage and invest equity across its core sectors – office, retail, industrial and social infrastructure, to create value and generate superior returns for its customers. CHC has a strong history of managing unlisted property funds and syndicates since 1995 and its products are consistently highly rated by external research groups. During 2015-2019, the company’s statutory profit after tax for stapled securityholders has increased at a CAGR of 18.86%. During the same time span, the company’s operating earnings per stapled security increased at a CAGR of 14.58%.
In the last five years, the company has delivered its securityholders 13.4% post tax growth in earnings per annum, and distribution growth of 12.4% per annum when the benefit of franking credits is included. The company is well-positioned for the future, supported by a high-quality team focused on delivering results for its securityholders and capital partners, positioning it well for resilient performance and shared growth. CHC continues to retain significant additional investment capacity, providing a buffer against any short-term volatility to capture opportunities, while also providing a meaningful avenue for future growth..png)
Key Performance Metrics (Source: Company Reports)
FY19 Performance Highlights: In the financial year 2019, the company reported a 34% growth in Operating Earnings EBITDA to $275 million and 25.5% increase in operating earnings to $220.7 million. FY19 was a record year for equity raising, with all sources of equity active and $3.4 billion of new equity inflow across the platform, translating into CHC’s largest ever year for transactions, with $5.0 billion of gross transactions and $3.3 billion of net acquisitions.
During the year, the company also successfully acquired and integrated the Folkestone platform into the Charter Hall business. In FY19, the Property Investment portfolio grew by 8.1% to $1.8 billion and generated a 9.1% Total Property Investment Return. During the period, the company’s managed funds increased by $7.2 billion to $30.4 billion driven by positive revaluation of $1.2 billion, $3.3 billion of net acquisitions, the $1.6 billion acquisition of Folkestone, and capital expenditure spend on developments of $1.0 billion. For the year, the company declared a distribution of 33.7 cents per share, up by 6% on last year, representing a distribution payout ratio of 71%.
1HFY20 Financial Summary.png)
FY19 Financial Summary (Source: Company Reports)
H1FY20 Results Highlights: In the first half of FY20, the company reported operating earnings of $225.8 million, or OEPS post-tax of 48.5cps, up 110% on pcp. For the period, the company reported statutory profit of $313.2 million, after tax attributable to stapled securityholders, up 235% on pcp. In H1FY20, the Property Investment portfolio grew by 13.4% to $2.1 billion and managed funds grew by $8.5 billion to $38.9 billion.
The company achieved these results while maintaining returns for its investor customers and through continued partnership with its tenant customers. During the half-year period, the company successfully launched various new partnerships with investors and new tenant partnership funds with BP Australia and Telstra. For H1FY20, the company declared distributions of 17.5cps, up 6% on pcp, representing a payout ratio of 36%.
.png)
Top 10 Shareholders: The top 10 shareholders have been highlighted in the table, which together form around 33.85% of the total shareholding.Vanguard Investments Australia Ltd. and Viburnum Funds Pty Ltd hold the maximum interest in the company at 6.94% and 4.49%, respectively..png)
Top 10 Shareholders (Source: Thomson Reuters)
Decent Dividend History: Charter Hall Group maintains a strong track record of paying regular distributions to its shareholders. From FY14 to FY19, the company’s distribution per security has increased at a CAGR (grossed up) of 12.4%. For FY19, the company paid a total distribution of 33.7cps, up 6% on last year. The company has maintained the same growth rate for H1FY20 distributions which stood at 17.5cps. Going forward, the Group intends to maintain the same growth rate in distribution; however, developments owing to the prevailing health and economic crisis need to be watched out for. Nonetheless, the company has demonstrated resilient performance to date.
.png)
Distribution Per Security Growth (Source: Company Reports)
Recent Updates: In February 2020, CHC sold 17.5% stake in the BP Partnership to Charter Hall Retail REIT (ASX: CQR) for around $77 million and at the same time, the company also participated in a block trade undertaken by Viva Energy (ASX: VEA) of its holding in VIVA Energy REIT (ASX VVR) and has acquired a 5% stake in VVR. In March 2020, the company received Charter Hall Office Trust (CHOT) performance fee of $148 million.
A Quick look at Key Margins: For H1FY20, the company reported gross margin of 89%, higher than the industry median of 73.7%. For the same time span, the company reported a net margin of 88.8%, higher than the industry median of 78.8%. The company has a current ratio of 2.37x, higher than the industry median of 0.64x, demonstrating that the company is well-positioned to pay its short-term obligations. .png)
Key Metrics (Source: Thomson Reuters)
What to expect: CHC continues to retain significant additional investment capacity, providing a buffer against any short-term volatility to capture opportunities, while also providing a meaningful avenue for future growth. The company currently has a balance sheet liquidity of $350 million and gearing of 2.8%.
In the Property Funds Management business, despite the transactional activity in H1FY20, CHC still has a $4.1 billion of investment growth capacity, leaving it well positioned to continue growing via its development pipeline as well of taking advantage of strategic opportunities as they arise. In FY20, the company expects 40% growth in post-tax operating earnings per security over FY19. This includes $98 million of the $148 million Charter Hall Office Trust (CHOT) performance fee received recently. Further, the company expects to increase its distribution by 6% in FY20.
Real Estate Outlook: As per the Reserve Bank of Australia, before the outbreak of COVID-19, the retail property market in the country was facing challenging conditions due to weak consumer spending and heightened competition. Following the outbreak, the retail tenants are asking the property owners to suspend the rent payments or reduce it substantially. However, a recovery is expected once the COVID-19 outbreak is contained. The record low interest rates in Australia are expected to increase the demand for commercial property assets..png)
Key Valuation Metrics (Source: Thomson Reuters)
Valuation Methodology: EV to Sales Multiple Based Relative Valuation (Illustrative).png)
EV to Sales Based Relative Valuation (Source: Thomson Reuters)
Note: All forecasted figures have been taken from Thomson Reuters, NTM: Next Twelve Months
Stock Recommendation: CHC continues to retain significant additional investment capacity, providing a buffer against any short-term volatility to capture opportunities. The company currently has a balance sheet liquidity of $350 million and gearing of 2.8%. In the last six and three months, the stock of CHC has corrected by 38.66% and 43.37%, respectively. The stock is currently trading close to its 52 weeks low price of $4.930. We have valued the stock using EV to Sales multiple based illustrative relative valuation method and arrived at a target price of lower double-digit upside (in percentage terms). For the purpose, we have taken the peer group - GPT Group (ASX: GPT), Dexus (ASX: DXS), LendLease Group (ASX: LLC), Stockland Corporation Ltd (ASX: SGP), etc. Considering the company’s strong track record of distribution payments, decent H1FY20 performance, long-term outlook, and current trading levels, we give a “Buy” recommendation on the stock at the market price of $7.24, up by 0.277% on 23 April 2020.
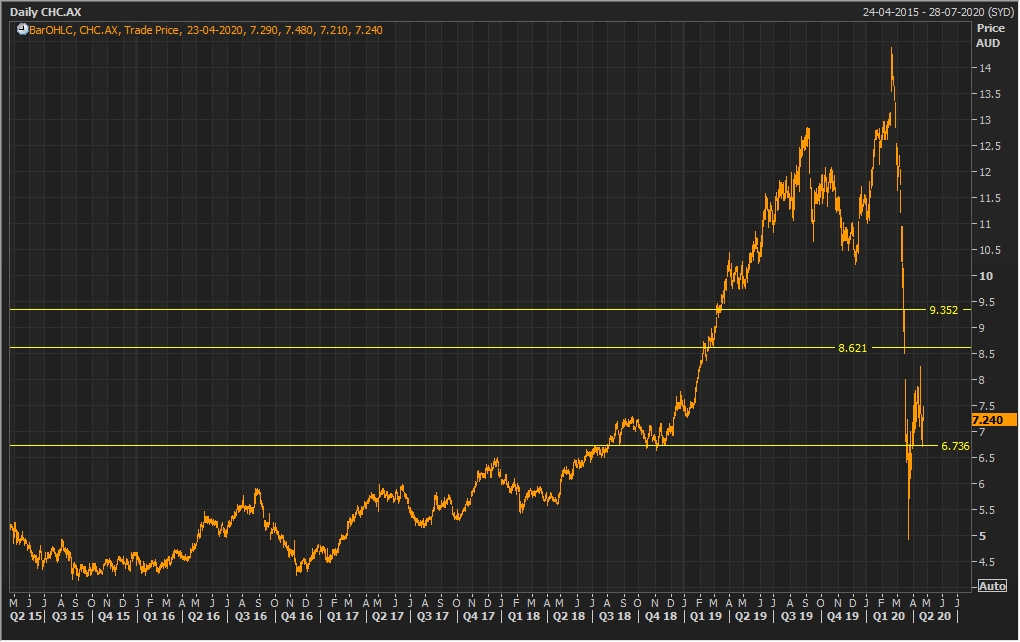
CHC Daily Technical Chart (Source: Thomson Reuters)
Disclaimer
The advice given by Kalkine Pty Ltd and provided on this website is general information only and it does not take into account your investment objectives, financial situation or needs. You should therefore consider whether the advice is appropriate to your investment objectives, financial situation and needs before acting upon it. You should seek advice from a financial adviser, stockbroker or other professional (including taxation and legal advice) as necessary before acting on any advice. Not all investments are appropriate for all people. Kalkine.com.au and associated pages are published by Kalkine Pty Ltd ABN 34 154 808 312 (Australian Financial Services License Number 425376). The information on this website has been prepared from a wide variety of sources, which Kalkine Pty Ltd, to the best of its knowledge and belief, considers accurate. You should make your own enquiries about any investments and we strongly suggest you seek advice before acting upon any recommendation. Kalkine Pty Ltd has made every effort to ensure the reliability of information contained in its newsletters and websites. All information represents our views at the date of publication and may change without notice. To the extent permitted by law, Kalkine Pty Ltd excludes all liability for any loss or damage arising from the use of this website and any information published (including any indirect or consequential loss, any data loss or data corruption). If the law prohibits this exclusion, Kalkine Pty Ltd hereby limits its liability, to the extent permitted by law to the resupply of services. There may be a product disclosure statement or other offer document for the securities and financial products we write about in Kalkine Reports. You should obtain a copy of the product disclosure statement or offer document before making any decision about whether to acquire the security or product. The link to our Terms & Conditions has been provided please go through them and also have a read of the Financial Services Guide. On the date of publishing this report (mentioned on the website), employees and/or associates of Kalkine Pty Ltd do not hold positions in any of the stocks covered on the website. These stocks can change any time and readers of the reports should not consider these stocks as personalised advice.
 Please wait processing your request...