Kalkine has a fully transformed New Avatar.

Company Overview: Evolution Mining Limited is a gold company. The Company is engaged in operating, identifying and developing gold related mining projects in Australia and New Zealand. Its segments are Cowal, Mungari, Mt Carlton, Mt Rawdon, Edna May, Cracow, Pajingo, Exploration and Corporate. It owns and operates approximately seven gold mines, including Cowal in New South Wales; Cracow, Pajingo, Mt Carlton and Mt Rawdon in Queensland, and Mungari and Edna May in Western Australia. The Cowal operation is an open pit mining operation with production from a range of different faces within the single pit. The Edna May gold mineralization consists of high-grade reef structures and associated stockwork veining hosted within approximately three en-echelon tonalitic gneiss intrusions (Edna May, Greenfinch and Golden Point). The Mt Carlton project is a high-sulfidation epithermal style deposit with mineralization occurring within felsic volcanic rocks on the northern margin of the Permian Bowen Basin.

EVN Details
FY19 Production Guidance is on Track despite Benign Q3FY19 Performance: Evolution Mining Limited (ASX: EVN) is involved in exploration, mine development, mine operations and the sale of gold and gold/copper concentrate in Australia. As of 1 May 2019, the market capitalization of the company stood at ~$5.41 Bn. Recently, the group disclosed Q3FY19 results wherein the group delivered March Quarter gold production of 175,901 oz at an All-in Sustaining Cost (AISC) of A$925/oz against the production of 181,996 ounces at an AISC of A$ 973/oz in December 2018 quarter. As per annual mineral resources and ore reserves statement as at December 31, 2018, gold mineral resources increased to 14.73Moz (Dec 2017: 14.24 Moz) and gold ore reserves increased to 7.46Moz (Dec 2017: 7.05Moz) after accounting for mining depletion of 902,000 oz. The Cowal GRE46 underground has grown significantly with Mineral Resources increasing by 134% to 1.41 Moz.
.png)
Production & Sales Data (Source: Company Reports)
The company delivered lower operating mine cash flow and net mine cash flow of A$168.3 Mn and A$107.8 Mn, respectively as compared to the previous quarter where the same were A$191.1 Mn and A$108.5 Mn. The lower operating cash flow was driven predominantly by timing of gold (20,936 oz) and copper sales (939 tonnes) and was partially offset by higher realised metal prices. The group’s capital expenditure reduced to A$60.6 Mn as compared to the December quarter capex of A$83.2 Mn. Extreme rainfall events at both Ernest Henry and Mt Carlton were exceptionally well managed with both sites delivering strong operational performances. Ernest Henry produced 22,419oz at an AISC of A$(510)/oz generating record net mine cash flow of A$59.5 Mn. Mt Carlton produced 26,116oz at an AISC of A$643/oz generating net mine cash flow of A$16.3 Mn. Despite softer performance in Q3FY19, the management expects the gold production to be in-line with the previous guidance which is in the range of 720,000-770,000 ounces at an ASIC of A$850-A$900 per ounces for full year.
Top 10 Shareholders: The top 10 shareholders have been highlighted in the table which together forms 33.48% of the total shareholding. Van Eck Associates Corporation and La Mancha Group International B.V. holds maximum interest in the company with stake of 14.01% and 9.54% respectively.
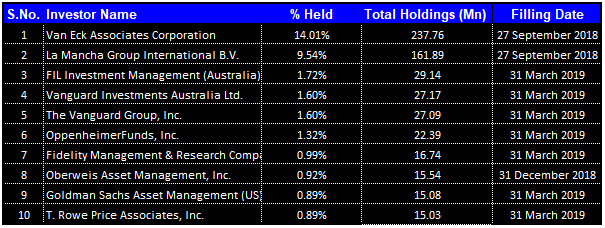
Top 10 Shareholders (Source: Thomson Reuters)
EVN Acquired Stake In Tribune Resources: On February 25, 2019, Evolution acquired a 19.9% stake in Tribune Resources Limited for a cash consideration of A$41.3 Mn. Tribune’s major asset is its interest in the East Kundana operation adjacent to Evolution’s Mungari mine. Also, on April 1, 2019, the company entered into an earn-in joint venture agreement with Enterprise Minerals Limited over the Murchison exploration project. This synergistic acquisition and agreement will support to achieve its business objectives in years to come.
Understanding Operations at Cowal, and Mungari Mine Sites: EVN has 100% interest in mines at Cowal, NSW. It produced 64,117oz of gold at an AISC of A$1,000/oz while in December quarter it produced 58,244oz involving an AISC of A$ 1,019/oz.The mine operating cash flow for the quarter was A$51.8 Mn. Net mine cash flow increased to A$15.9 Mn post sustaining capital of A$8.3 Mn and major capital of A$27.6 Mn. The major capital was associated with growth projects including the Stage H cutback and construction pre-works of the Integrated Waste Landform tailings facility.
Besides this, EVN has also 100% interest in mines at Mungari, WA. During the third quarter, it produced 24,966 oz of gold at an AISC of A$1,521/oz while in Dec 2018 quarter it produced 29,992oz at an AISC of A$1,474/oz. Mine operating cash flow for the quarter was A$10.4 Mn. The net mine cash flow was A$2.5 Mn as compared to the December quarter of A$5.7 Mn post sustaining and major capital investment of A$7.9 Mn.
Key Updates Over Mt Carlton, Mt Rawdon, Cracow, and Ernest Henry Mine Sites: From the Mt Carlton mine site front, the company produced 26,116 oz of payable gold during the quarter comprised of 19,258 oz contained in 12,507 dry metric tonnes (dmt) of gold concentrate and 6,859 oz in gold doré. The AISC decreased to A$643/oz from the December quarter figure of A$715/oz. The mine operating cash flow of A$22.5 Mn and net mine cash flow of A$16.3 Mn (Dec qtr: A$20.9 Mn), was generated post sustaining and major capital of A$6.3 Mn.
Besides this, Mt Rawdon mine site produced 20,124oz of gold during the March 2019 quarter. The mine operating cash flow of A$9.8 Mn and net mine cash flow of A$6.2 Mn was generated after sustaining and major capital expenditure of A$3.7 Mn. The majority of the capital expenditure was on open pit stripping and the Tailings Storage Facility buttress.
On Cracow mine site front, the company produced 18,158oz of gold at an AISC of A$1,310/oz. The mine operating cash flow for the quarter was A$13.2 Mn. During the quarter, the plant continued to achieve a robust throughput performance with 143kt processed at an average grade of 4.36/t gold.
Finally, the company produced 22,419 oz of gold and 4,597 tonnes of copper at an AISC of negative A$(510)/oz at Ernest Henry mine site. The operating cash costs (C1) was negative A$(794)/oz after accounting for copper and silver by-product credits. Cash operating costs (C1) included by-product credits of A$(1,916)/oz. Copper sales in the quarter were 4,597t at an average copper price of A$9,269/t.
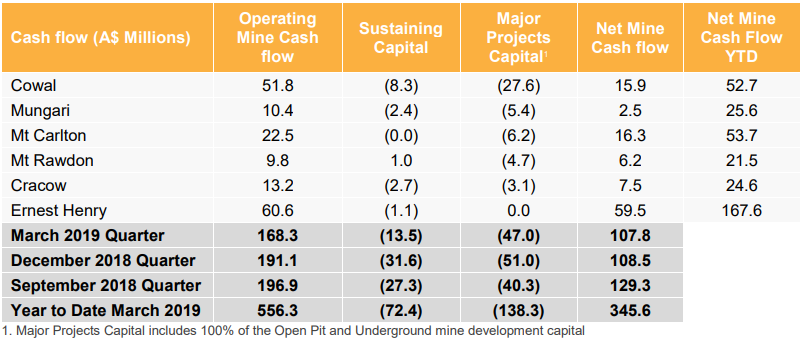
Cash Flow Data (Source: Company Reports)
Financial Highlights for Jan-March’19: The March 2019 quarter saw all operations continue their consistent position of being cash flow positive after meeting all operating and capital investment programs. Despite the slightly lower gold and copper production, net mine cash flow of A$107.8 Mn was in-line with the December 2018 quarter of A$108.5 Mn.
Evolution sold 167,598 oz of gold at an average gold price of A$1,798/oz while in December 2018 quarter it sold 188,534 oz at A$1,730/oz.Deliveries into the hedge book totalled 37,500 oz at an average price of A$1,691/oz with the remaining 130,098 oz of gold delivered on spot markets at an average price of A$1,828/oz. Evolution generated operating mine cash flow of A$168.3 Mn which was down on the December 2018 quarter of A$191.1 Mn. This was driven predominantly by timing of gold (20,936 oz) and copper sales (939 tonnes) and was partially offset by higher realised metal prices.
Capital Expenditure & Investments to Support Long Term Prospects: The major capital expenditure items included: Cowal Stage H development, Float Tails Leach and Integrated Waste Landform projects (A$21.0 Mn); underground construction at Mt Carlton (A$1.0 Mn); open pit capital waste stripping at Mt Carlton (A$5.2 Mn) and Mt Rawdon (A$3.7 Mn); and underground mine development at Cracow (A$3.1 Mn) and Mungari (A$5.4 Mn).
Sustaining capital is tracking to the bottom end and major capital investment is tracking to the middle of the updated full year guidance released in October 2018. Discovery expenditure in the quarter totalled A$13.5 Mn which is higher than the previous quarter of A$10.3 Mn. The increase in discovery expenditure was partly related to commencing development of the Cowal exploration decline (A$2.0 Mn). Corporate administration costs were A$5.5 Mn while in December 2018 quarter it was A$7.0 Mn.
Moreover, the company has done the capital investment of A$60.5 Mn during the March quarter, comprising of A$47.0 Mn on major projects and A$13.5 Mn on sustaining capital. Capital expenditure and prudent investment during the quarter might support the business objectives in the upcoming period. During the quarter, Evolution returned A$59.3 Mn to shareholders via the fully franked interim dividend of 3.5 cents per share for the half-year to 31 December 2018 and invested A$41.3 Mn to acquire 11.05 Mn shares, or a 19.9% stake, in Tribune Resources Limited.
Strategic Objectives Led to a Decline in Cash Balance: The Group’s cash balance on March 31, 2019 was A$255.9 Mn (31 December 2018: A$313.6 Mn). The reduction was due to the scheduled debt repayment (A$25.0 Mn); payment of the interim dividend of (A$59.3 Mn); the investment in Tribune Resources (A$41.3 Mn) and the final settlement payment for Castle Hill (A$3.0 Mn). EVN’s hedge book as on March 31, 2019, was 437,500 oz at an average price of A$1,826/oz for quarterly deliveries to June 2023.
.png)
Cash Flow Statement (Source: Company Reports)
H1FY19 Result: The company reported a statutory net profit after tax of A$91.1 Mn and underlying profit after tax of A$92.2 Mn. The lower profit was driven predominantly by the impact of non-cash related items which reduced profit before tax by A$35.3 Mn while cash related items reduced profit before tax by A$11.3 Mn. These were partially offset by lower tax expense of A$11.6 Mn and the impact of the divestment of Edna May of A$3.7 Mn.
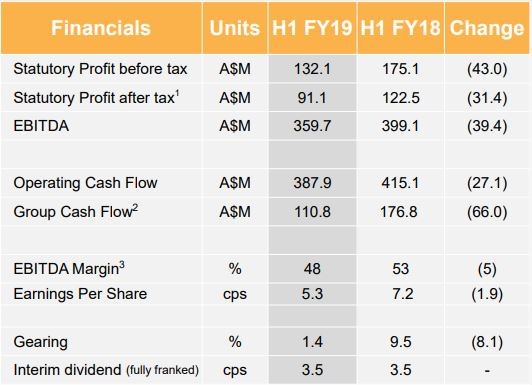
H1FY19 P&L Statement (Source: Company Reports)
Key Ratios: Its EBITDA margin for H1FY19 stands at 45.6% better than the industry median of 34.6%. Its current ratio for H1FY19 stands at 2.31x better than the industry median of 1.87x, which implies the company is in a better position to address its short-term obligations. Its D/E ratio has reduced from 0.18x in H1FY18 to 0.15x in H1FY19, implying reduction in debt position of the company. EVN has reduced its long-term debt percentage to total capital from 11.4% in H1FY18 to 9.2% in H1FY19.
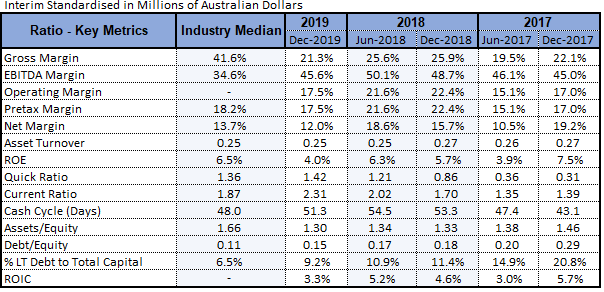
Key Ratio Metrics (Source: Thomson Reuters)
Gold Outlook: It is expected that the yellow metal may face a test from an upcoming U.S. Federal Reserve monetary policy meeting and unemployment data. However, the demand for Gold has risen as most reserve banks have been accumulating the metal for near term risk concerns, and the corporates have been using Gold as a global hedging tool for their investments in various markets. Gold Future has found support at the 200 daily moving average, and it is expected to bounce back following the positive global events such as cooling-off trade concerns between US and China, US fed easing of the policy rates, etc.
What to expect: FY19 Group production guidance has been maintained in the range of 720,000 – 770,000 oz at an AISC of A$850 – A$900 per oz. The company is expected to deliver above mid-point of production guidance and at top end of AISC guidance. The June quarter production guidance has been estimated in the range of 190,000 – 195,000 oz.
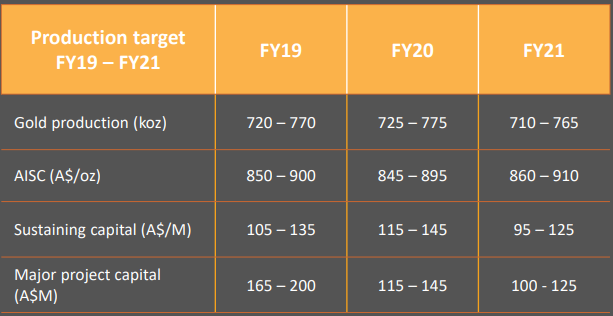
EVN Guidance (FY19-FY21) (Source: Company Reports)
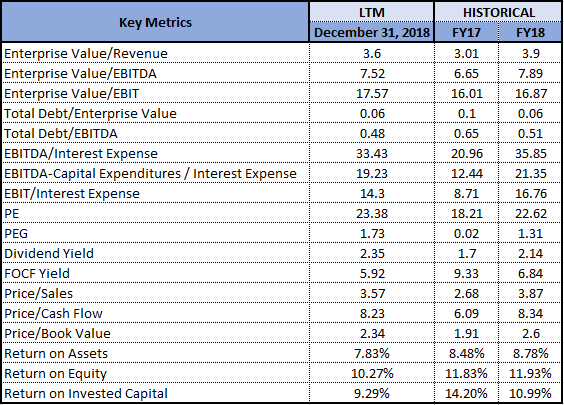
Key Valuation Metrics (Source: Thomson Reuters)
Valuation Methodology-
Method 1:
Price to Cash Flow multiple Approach (NTM): While Valuing Evolution Mining Limited, we have considered Next Twelve Month (NTM) P/CF of its peers which were Gold Road Resources Ltd (NTM P/CF stood at 19.47x), Newcrest Mining Ltd (NTM P/CF stood at 9.44x), Northern Star Resources Ltd (NTM P/CF stood at 8.40x), OceanaGold Corp (NTM P/CF stood at 6.41x), OZ Minerals Ltd (NTM P/CF stood at 7.01x), Regis Resources Ltd (NTM P/CF stood at 9.21x), Resolute Mining Ltd (NTM P/CF stood at 3.51x),and Saracen Mineral Holdings Ltd (NTM P/CF stood at 9.54x).
.PNG)
*NTM-Next Twelve Months
Method – 2
EV/EBITDA Multiple Approach (NTM): While Valuing Evolution Mining Limited, we have considered Next Twelve Month (NTM) EV/EBITDA of its peers which were Gold Road Resources Ltd (NTM EV/EBITDA stood at 20.36x), Newcrest Mining Ltd (NTM EV/EBITDA stood at 8.09x), Northern Star Resources Ltd (NTM EV/EBITDA stood at 6.64x), OceanaGold Corp (NTM EV/EBITDA stood at 5.81x), OZ Minerals Ltd (NTM EV/EBITDA stood at 5.22x), Regis Resources Ltd (NTM EV/EBITDA stood at 6.60x), Resolute Mining Ltd (NTM EV/EBITDA stood at 4.10x),and Saracen Mineral Holdings Ltd (NTM EV/EBITDA stood at 7.03x).
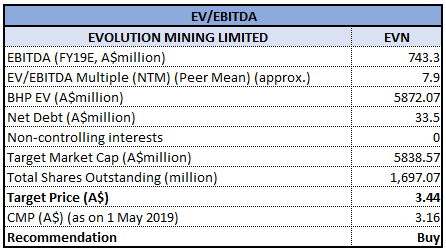
(Note: All forecasted figures and peers' info have been taken from Thomson Reuters), *NTM-Next Twelve Months.
Stock Recommendation: Evolution Mining’s share has generated negative YTD return of 12.36%, while in the span of 6 months EVN generated a gain of 3.91%. Fundamentally, Evolution has shown strong operational performance with improvement in All-In-Sustainable-Cost, which has brought EVN into the list of top low-cost gold producers in the world. The Gold Mineral Resources and Ore Reserves increased from 14.24 Mn oz and 7.05 Mn oz as on December 31, 2017 to 14.73 Mn oz and 7.46 Mn oz on December 31, 2018 respectively. Going forward, more positive drilling results are expected to come from mines such as Cowal Mine & Mungari Mine, and Murchison Project, which might support the topline growth of the business. Further, the company focuses on reducing its debt level, which will strengthen its balance sheet position. With the bright prospects of the business over the long term, we have valued the stock using two Relative valuation methods, Price/cash flow ratio and EV/EBITDA multiple and arrived at a single digit upside growth (%) in the next 12 months. Hence, considering the aforesaid facts and current trading levels, we recommend a “Buy” rating on the stock at the current market price of A$3.160 (down 0.94% on May 1, 2019).
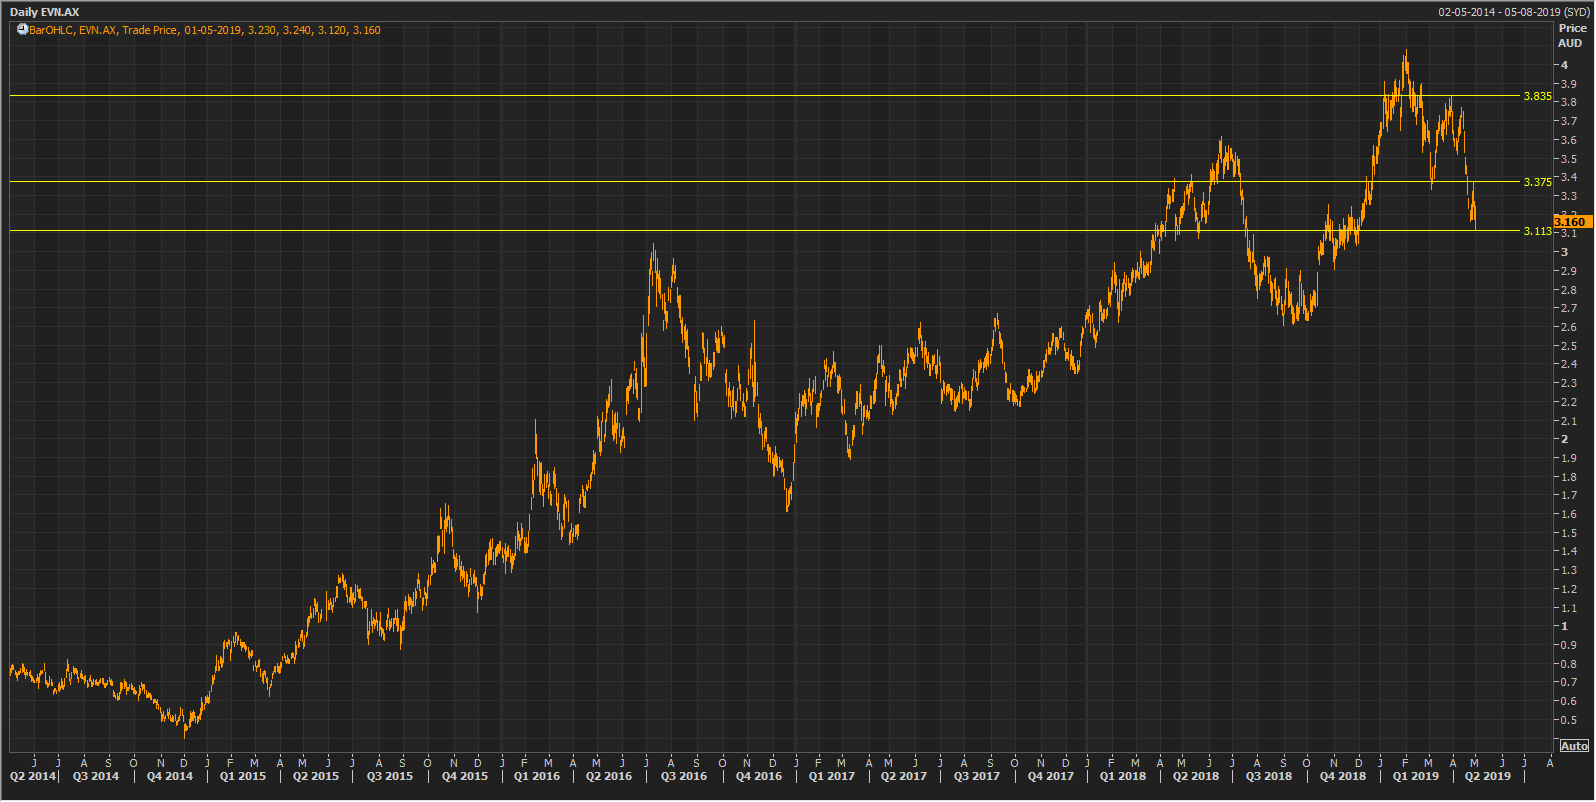
EVN Daily Chart (Source: Thomson Reuters)
Disclaimer
The advice given by Kalkine Pty Ltd and provided on this website is general information only and it does not take into account your investment objectives, financial situation or needs. You should therefore consider whether the advice is appropriate to your investment objectives, financial situation and needs before acting upon it. You should seek advice from a financial adviser, stockbroker or other professional (including taxation and legal advice) as necessary before acting on any advice. Not all investments are appropriate for all people. Kalkine.com.au and associated pages are published by Kalkine Pty Ltd ABN 34 154 808 312 (Australian Financial Services License Number 425376). The information on this website has been prepared from a wide variety of sources, which Kalkine Pty Ltd, to the best of its knowledge and belief, considers accurate. You should make your own enquiries about any investments and we strongly suggest you seek advice before acting upon any recommendation. Kalkine Pty Ltd has made every effort to ensure the reliability of information contained in its newsletters and websites. All information represents our views at the date of publication and may change without notice. To the extent permitted by law, Kalkine Pty Ltd excludes all liability for any loss or damage arising from the use of this website and any information published (including any indirect or consequential loss, any data loss or data corruption). If the law prohibits this exclusion, Kalkine Pty Ltd hereby limits its liability, to the extent permitted by law to the resupply of services. There may be a product disclosure statement or other offer document for the securities and financial products we write about in Kalkine Reports. You should obtain a copy of the product disclosure statement or offer document before making any decision about whether to acquire the security or product. The link to our Terms & Conditions has been provided please go through them and also have a read of the Financial Services Guide. On the date of publishing this report (mentioned on the website), employees and/or associates of Kalkine Pty Ltd do not hold positions in any of the stocks covered on the website. These stocks can change any time and readers of the reports should not consider these stocks as personalised advice.
 Please wait processing your request...