Kalkine has a fully transformed New Avatar.
Section 1: Company Overview and Fundamentals
1.1 Company Overview:
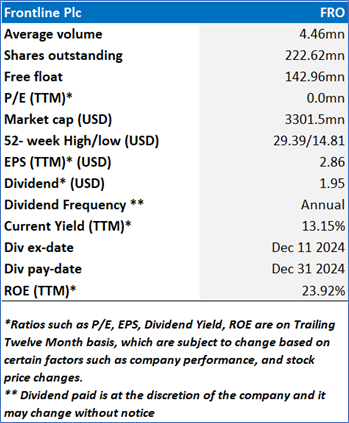
Frontline PLC (NYSE: FRO) is a Cyprus-based company primarily engaged in the transportation industry, with a primary focus on the maritime transport of crude oil and refined products. The company owns and manages a fleet of various tankers, including VLCC, Suezmax, and LR2/Aframax vessels, designed for the transport of oil and cargo. FRONTLINE PLC operates on a global scale.
Kalkine’s Dividend Income Report covers the Company Overview, Key positives & negatives, Investment summary, Key investment metrics, Top 10 shareholding, Business updates and insights into company recent financial results, Key Risks & Outlook, Price performance and technical summary, Target Price, and Recommendation on the stock.
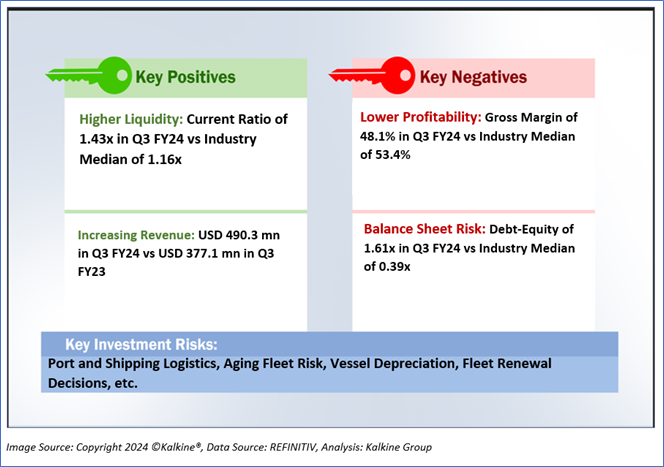
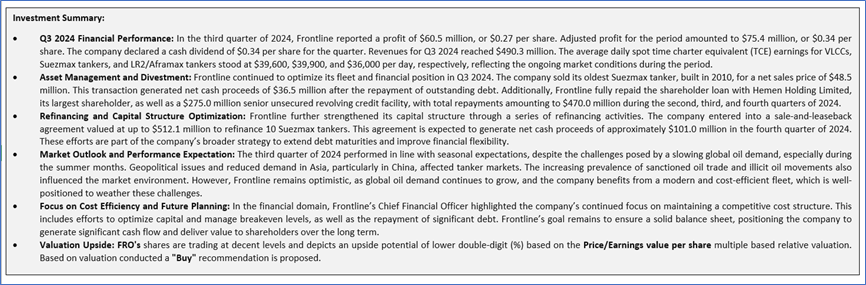
1.2 The Key Positives, Negatives, and Investment summary
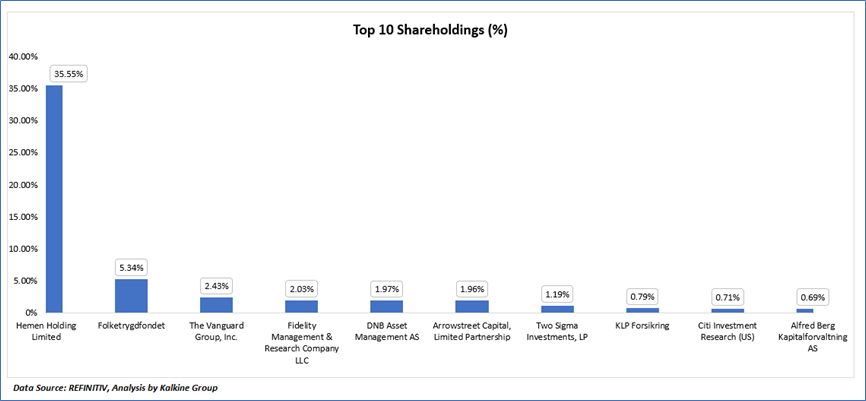
1.3 Top 10 shareholders:
The top 10 shareholders together form ~52.67% of the total shareholding, signifying concentrated shareholding. Hemen Holding Limited and Folketrygdfondet, are the biggest shareholders, holding the maximum stake in the company at ~35.55% and ~5.34%, respectively.
1.4 Dividend Distribution:
The dividend distribution trend has been relatively stable, with periodic dividend payouts even during periods of price fluctuations. FRO has maintained a consistent dividend policy with periodic payments even as its stock price has fluctuated. The company seems to prioritize shareholder returns, which may appeal to income-focused investors. However, the declining stock price in recent months suggests that the company's ability to continue paying dividends at the same level may come under pressure if the negative trend persists. Investors should monitor the company's earnings and dividend announcements closely for any signals of changes in dividend payouts in the future.
From mid-2022 to early 2023, there are several dividend payments marked by the yellow indicators. During this period, the stock price exhibits a strong upward movement, reaching a high around April 2023. The dividend payments seem relatively steady, and they occur during a general uptrend in the stock price. This could indicate a strong cash position and a healthy operational performance by the company, which allowed for consistent dividends. From mid-2023 onward, there is an increase in price volatility, as the stock experiences significant fluctuations with an overall downtrend. Despite the price decline, the dividend payments appear to continue regularly, suggesting that the company is attempting to maintain its commitment to paying dividends to shareholders. Even though the stock price drops sharply starting around April 2023, the company continues to pay dividends, which could signal that the company is prioritizing shareholder returns despite challenging market conditions.
By mid-2024, the stock price has fallen to a lower level (around $14.80 as shown on the right side of the chart), and yet the yellow markers continue to indicate dividend payouts. This could suggest that the company is maintaining a high dividend payout rate despite a lower stock price, which may attract investors looking for yield. However, this also raises concerns about the sustainability of such dividends if the company's performance does not improve, as consistent dividend payouts amidst a declining stock price might strain financial resources.\

1.5 Key Metrics
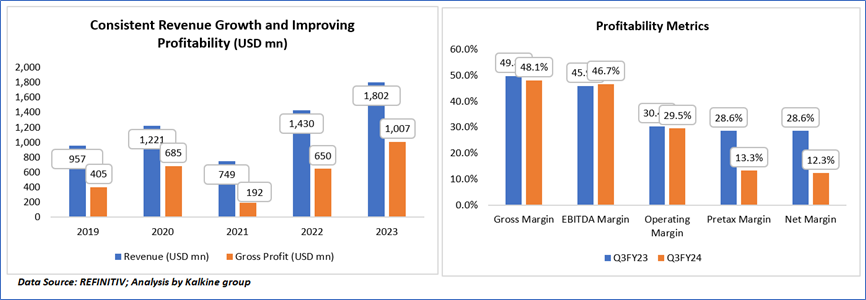
Section 2: Financial Highlights
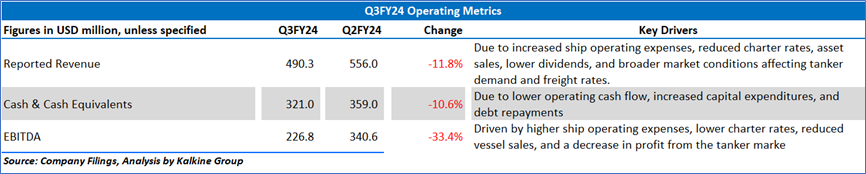
2.1 Insights of Q3FY24:
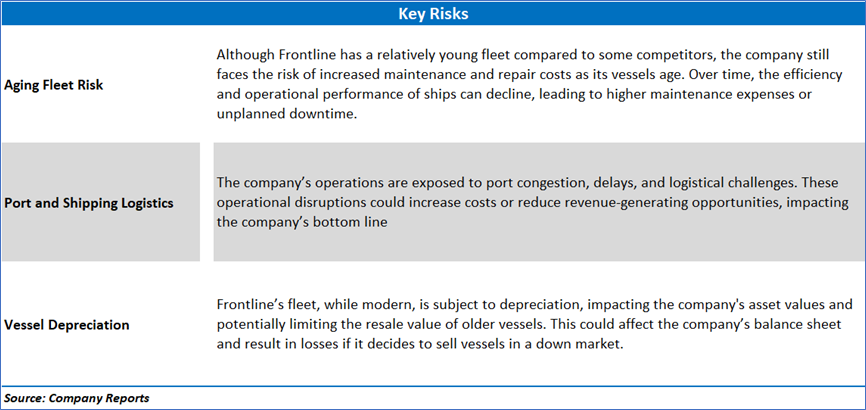
Section 3: Key Risks and Outlook:
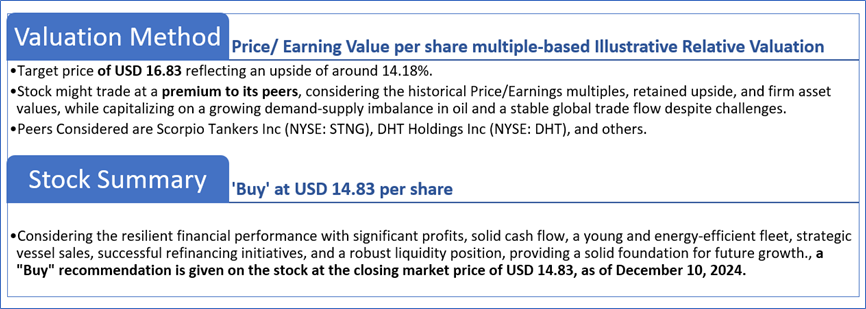
Section 4: Stock Recommendation Summary:
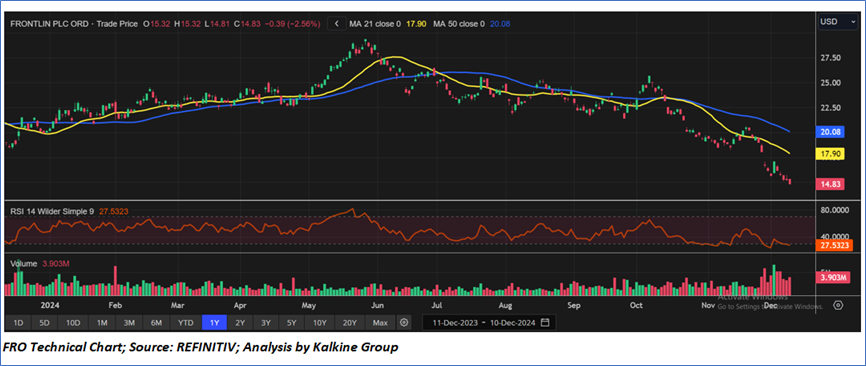
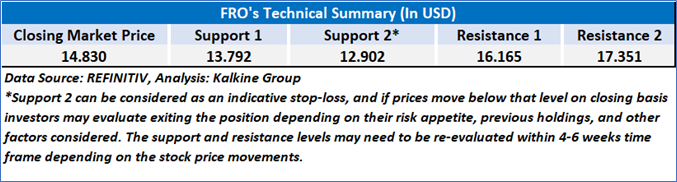
4.1 Technical Summary:
Price Performance:
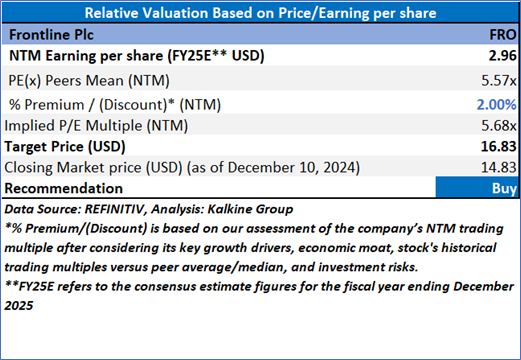
4.2 Fundamental Valuation
Valuation Methodology: Price/Earnings Per Share Multiple Based Relative Valuation
Markets are trading in a highly volatile zone currently due to certain macroeconomic issues and geopolitical tensions prevailing. Therefore, it is prudent to follow a cautious approach while investing.
Note 1: Past performance is not a reliable indicator of future performance.
Note 2: The reference date for all price data, currency, technical indicators, support, and resistance levels is December 10, 2024. The reference data in this report has been partly sourced from REFINITIV.
Note 3: Investment decisions should be made depending on an individual's appetite for upside potential, risks, holding duration, and any previous holdings. An 'Exit' from the stock can be considered if the Target Price mentioned as per the Valuation and or the technical levels provided has been achieved and is subject to the factors discussed above.
Note 4: The report publishing date is as per the Pacific Time Zone.
Technical Indicators Defined: -
Support: A level at which the stock prices tend to find support if they are falling, and a downtrend may take a pause backed by demand or buying interest. Support 1 refers to the nearby support level for the stock and if the price breaches the level, then Support 2 may act as the crucial support level for the stock.
Resistance: A level at which the stock prices tend to find resistance when they are rising, and an uptrend may take a pause due to profit booking or selling interest. Resistance 1 refers to the nearby resistance level for the stock and if the price surpasses the level, then Resistance 2 may act as the crucial resistance level for the stock.
Stop-loss: It is a level to protect against further losses in case of unfavorable movement in the stock prices.
This report has been issued by Kalkine Pty Limited (ABN 34 154 808 312) (Australian financial services licence number 425376) (“Kalkine”) and prepared by Kalkine and its related bodies corporate authorised to provide general financial product advice. Kalkine.com.au and associated pages are published by Kalkine.
Any advice provided in this report is general advice only and does not take into account your objectives, financial situation or needs. You should therefore consider whether the advice is appropriate to your objectives, financial situation and needs before acting upon it.
There may be a Product Disclosure Statement, Information Statement or other offer document for the securities or other financial products referred to in Kalkine reports. You should obtain a copy of the relevant Product Disclosure Statement, Information Statement or offer document and consider the statement or document before making any decision about whether to acquire the security or product.
Choosing an investment is an important decision. If you do not feel confident making a decision based on the recommendations Kalkine has made in our reports, you should consider seeking advice from a financial adviser, stockbroker or other professional (including taxation and legal advice) before acting on any advice in this report or on the Kalkine website. Not all investments are appropriate for all people.
The information in this report and on the Kalkine website has been prepared from a wide variety of sources, which Kalkine, to the best of its knowledge and belief, considers accurate. Kalkine has made every effort to ensure the reliability of information contained in its reports, newsletters and websites. All information represents our views at the date of publication and may change without notice. The information in this report does not constitute an offer to sell securities or other financial products or a solicitation of an offer to buy securities or other financial products. Our reports contain general recommendations to invest in securities and other financial products.
Kalkine is not responsible for, and does not guarantee, the performance of the investments mentioned in this report This report may contain information on past performance of particular investments. Past performance is not an indicator of future performance. Hypothetical returns may not reflect actual performance. Any displays of potential investment opportunities are for sample purposes only and may not actually be available to investors. To the extent permitted by law, Kalkine excludes all liability for any loss or damage arising from the use of this report, the Kalkine website and any information published on the Kalkine website (including any indirect or consequential loss, any data loss or data corruption). If the law prohibits this exclusion, Kalkine hereby limits its liability, to the extent permitted by law, to the resupply of services..
Please also read our Terms & Conditions and Financial Services Guide for further information. Employees and/or associates of Kalkine and its related entities may hold interests in the securities or other financial products covered in this report or on the Kalkine website. Any such employees and associates are required to comply with certain safeguards, procedures and disclosures as required by law.
Kalkine Media Pty Ltd, an affiliate of Kalkine Pty Ltd, may have received, or be entitled to receive, financial consideration in connection with providing information about certain entity(s) covered on its website including entities covered in this Report.
 Please wait processing your request...