Kalkine has a fully transformed New Avatar.

Company Overview: Jupiter Mines Limited (Jupiter) is an Australia-based Company engaged in the evaluation and exploration interests, as well as the development of steel feed related projects. The Company focuses on exploring iron ore. The Company owns 49.9% interest in Tshipi e Ntle Manganese Mining (Tshipi). Tshipi owns two manganese projects in the Kalahari Manganese fields: Tshipi Borwa and Tshipi Bokone. Tshipi’s project, Tshipi Borwa is developed as a new standalone open-pit manganese mine. Tshipi Borwa is located in the Southern portion of the Kalahari Manganese Field. The Company’s Central Yilgarn Iron Project (CYIP) area is located 130kilometer by road northwest of the town of Menzies. The CYIP Consists of Mount Mason DSO Hematite Project and Mount Ida Magnetite Project.
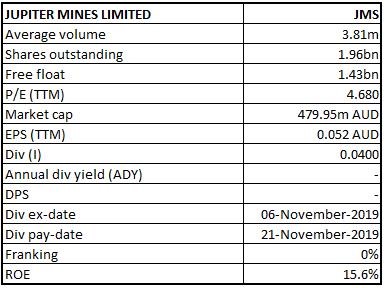
JMS Details
Decent FY19 Top-line and Bottom-line Performance: Jupiter Mines Limited (ASX: JMS) is involved in the operation of Tshipi Manganese Mine in South Africa and the sale of manganese ore. The Tshipi Borwa Manganese Mine is a long-life, open pit manganese mine with an integrated ore processing plant located in the Kalahari Manganese Fields in the Northern Cape Province of South Africa. Tshipi mine is one of the five greatest manganese mines in the world and the largest single manganese mine in South Africa.
Its top-line and bottom-line performance for FY19 were excellent as the group delivered revenue and net income growth of 36.46% and 49.67%, respectively, on the previous year. Its total revenue for FY19 stood at $13.1 Mn as compared to $9.6 Mn in the previous year. Its net income for FY19 stood at $138.0 Mn as compared to $92.2 Mn in the previous year, mainly due to the non-operating income.
After receiving its share of dividend from Tshipi in July, Group’s net consolidated cash balance for the August Quarter was reported at $75,890,556, as compared to $35,494,591 in the previous quarter. Due to a planned vessel sailing in the first week of September, overall sales volumes were marginally impacted; however, it remains to track for the financial year. The road and rail volumes realised were more than expected in the August quarter, with road volumes ahead of plan due to the movement of an additional low-grade product. Decent profitability margins for the first half of FY20 reflected the strength of the balance sheet and cash flows.
Going forward, the company is determined in increasing production along with reducing operating costs.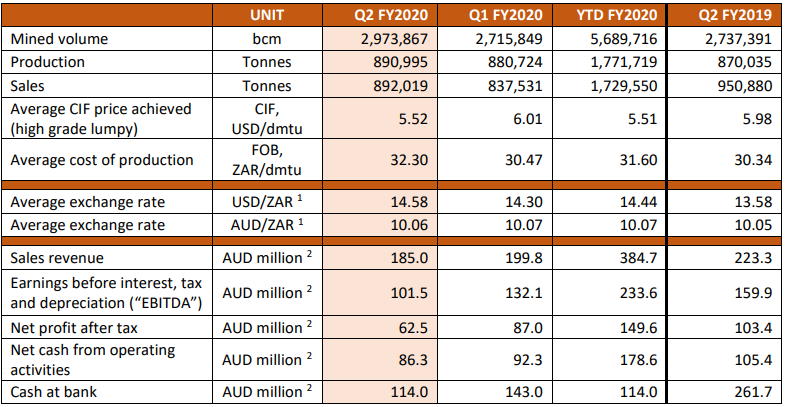
Quarterly Production, Sales and Financial Information (Source: Company Reports)
H1FY20 Key Highlights for the period ended August 31, 2019:Revenue & other income for the period was reported at $6.6 Mn as compared to $6.8 Mn in the previous corresponding period. Consolidated net profit after tax for the period was reported at $69.2 Mn as compared to $108.2 Mn in the previous corresponding period. Consolidated cash position for the period was reported at $76.6 Mn as compared to $15.5 Mn in the previous corresponding period. Basic earnings per share for the period was reported at $0.0353 as compared to $0.0556 in the previous corresponding period.
Despite the recent decline in the average manganese price, the Board of Directors declared a half-year interim dividend (unfranked) of $0.04 per share with a pay-out ratio of 90.7% as compared to interim dividend of $0.05 per share with pay-out ratio of 92.6% in the previous corresponding period. The interim dividend record date was 7 November 2019 and the dividend was paid on 21 November 2019.
JMS’s manganese marketing branch in South Africa sold 845,035 dmt, which resulted into a marketing fee income of ZAR63.1 Mn ($6.3 Mn) as compared to ZAR63.1 Mn ($6.5 Mn) in the previous corresponding period.
Its central Yilgarn Iron Ore project comprises the Mount Mason DSO Hematite and Mount Ida Magnetite projects, which are currently under maintenance and no development or exploration activities were undertaken during the half-year period.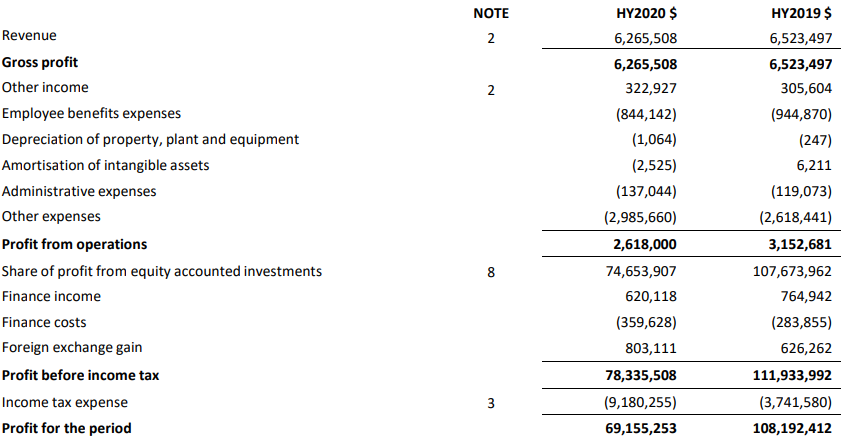
JMS Consolidated Income Statement for H1FY20 (Source: Company Reports)
Lower Manganese Price Reduced Tshipi Margins: As per the company’s Tshipi mine highlights, sales for the first half period of FY20 stood at 1.73 Mn tonnes as compared to 1.87 Mn tonnes in the previous corresponding period. Production for the first half stood at 1.77 Mn tonnes as compared to 1.78 Mn tonnes in the previous corresponding period. Average cost per tonne on FOB (Free on Board) for the period stood at ZAR31.60/dmtu as compared to ZAR29.38/dmtu in the previous corresponding period. Gross revenue for the period stood at ZAR4,670 Mn as compared to ZAR5,323 Mn in the previous corresponding period. Earnings before interest, tax and depreciation for the period stood at ZAR2,352 Mn as compared to ZAR3,202 Mn in the previous corresponding period. Net profit after tax for the period stood at ZAR1,506 Mn as compared to ZAR2,087 Mn in the previous corresponding period. Net cash from operating activities for the period stood at ZAR1,798 Mn as compared to ZAR2,590 Mn in the previous corresponding period. Tshipi has returned dividends to Jupiter of ZAR830 Mn for H1FY20, versus ZAR948 Mn for H1FY19. The decrease in dividends can be attributed to a softening of manganese prices. Despite this, Tshipi has maintained high levels of cash inflows along with low operating costs.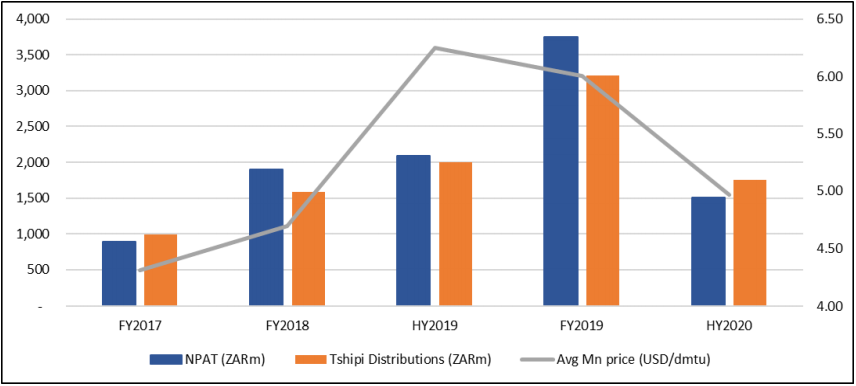
Tshipi Key Metrics (Source: Company Reports)
Tshipi Operational Highlights: Mined volume for the half-year period was reported at 5,689,716 Bcm as compared to 5,246,857 Bcm in the previous corresponding period. Production for the period was reported at 1,771,719 tonnes as compared to 1,786,133 tonnes in the previous corresponding period. Sales for the period was reported at 1,729,550 tonnes as compared to 1,875,135 tonnes in the previous corresponding period. Average cost of production (FOB) for the period was reported at ZAR31.60 per dmtu as compared to ZAR29.38 per dmtu in the previous corresponding period. Average CIF (cost, insurance and freight) price achieved (high grade lumpy) for the period was reported at USD5.51 per dmtu as compared to USD6.52 per dmtu in the previous corresponding period.
The cost of production for the period stood at ZAR31.60 ($3.14) per dmtu (FOB) as compared to ZAR29.38 ($3.03) per dmtu in the previous corresponding period. 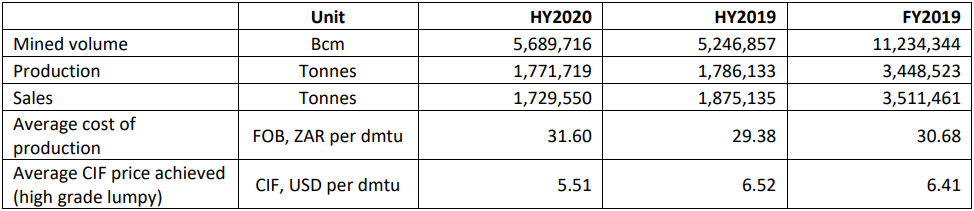
Summary of operating and financial information for Tshipi Mine (Source: Company Reports)
Top 10 Shareholders: The top 10 shareholders have been highlighted in the table, which together form around 41.67% of the total shareholding. APG Asset Management N.V. and AMCI Euro Holdings B.V. hold maximum interests in the company at 12.90% and 7.44%, respectively.
Recently, the company’s Director Hans Mende acquired 72,922,686 shares at $22,120,469.00 for $0.303 per ordinary share, effective from December 3, 2019, taking the final holdings to 145,845,372 shares under AMCI and 107,113,430 shares under HJM Jupiter L.P.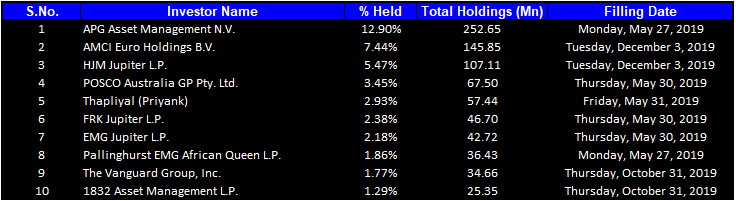
Top 10 Shareholders (Source: Thomson Reuters)
A Quick Look at Key Metrics: Its EBITDA margin and net margin for H1FY20 stood at 41.8% and 1103.7%, better than the industry median of 33.3% and 10.6%, respectively, implying decent fundamental of the company. Its current ratio for H1FY20 stood at 2.8x, better than the industry median of 1.87x, implying the company’s decent liquidity position. Its ROE for H1FY20 stood at 15.6%, better than the industry median of 5.8%, which implies that the company generated a better return for its shareholders than its peer group.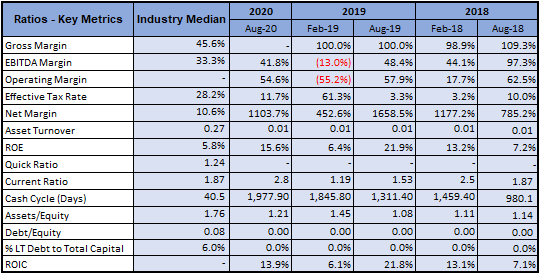
Key Metrics (Source: Thomson Reuters)
Key Risks: The company is susceptible to certain risks such as fluctuations in the price of manganese ore; fluctuations in the third party contractor costs; reduction in the global demand for steel; risks arising from mining operations being concentrated at one mine; economic, political or social instability in South Africa may affect operations or profits; and a range of other economic, environmental and social sustainability risks faced by all other mining companies in an open economy.
What to expect: Despite the delay in the mining activities, Tshipi management is confident of increasing volumes following an overhaul of excavators, resolution of drilling inefficiencies and the completion of a difficult mining cut.
Tshipi commenced mining the barrier pillar between the Borwa and Mamatwan pits in August after signing an agreement with South32 Limited in June, resultantly actual mining volumes for the barrier pillar area were ahead for the period. Rail volumes were in-line with Tshipi’s MECA allocation, resultantly combined rail and road volumes for the half-year period were ahead of plan. Due to additional low-grade volumes moved, road volumes are ahead of plan.
Moreover, Tshipi opened an additional export route at a similar cost to current routes following the commencement of shipping through the Namibian Port of Lüderitz in the first week of September. Following this development, overall sales volumes remain on track to meet the FY20 target of 3 Mn tonnes.
In order to realise further value for shareholders, the company has launched a review into strategic options available for its central Yilgarn Iron Ore projects. Considering economic reassessment and statutory requirements, JMS has commenced stakeholder consultation relating to its Mount Mason project.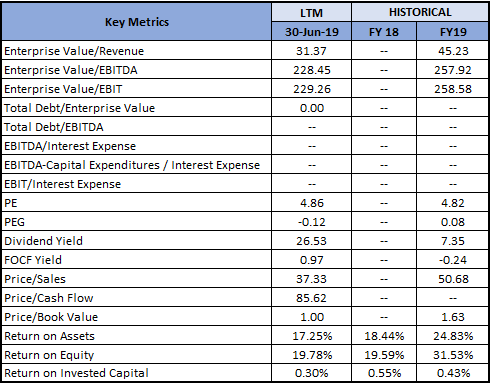
Key Valuation Metrics (Source: Thomson Reuters)
Valuation Methodology: Price to Earnings (PE) Multiple Approach
Price to Earnings (PE) Multiple Approach (Source: Thomson Reuters)
Note: All forecasted figures and peers have been taken from Thomson Reuters, *NTM-Next Twelve Months
Stock Recommendation: JMS’ share price fell by 30.00% in the past six months, while it posted a negative return of ~11% in the span of one year. Currently, the stock is trading towards its 52-week low of $0.230, proffering an opportunity for share accumulation. On technical analysis front, it is trading close to a strong support level of $0.229. The company has delivered decent top-line and bottom-line performance for FY19 and profitability margins for the first half of FY20. Its strong balance sheet along with cash flows depicts the company’s strategy to deliver an improved and sustainable returns for its shareholders in the coming times. Looking at the business prospects over the long-term, we have valued the stock using a relative valuation method, i.e., Price to Earnings (PE) multiple, and arrived at a target price of double-digit growth (in % term). Hence, we give a “Buy” recommendation on the stock at the current market price of A$0.235 per share, down 4.082% on December 11, 2019.
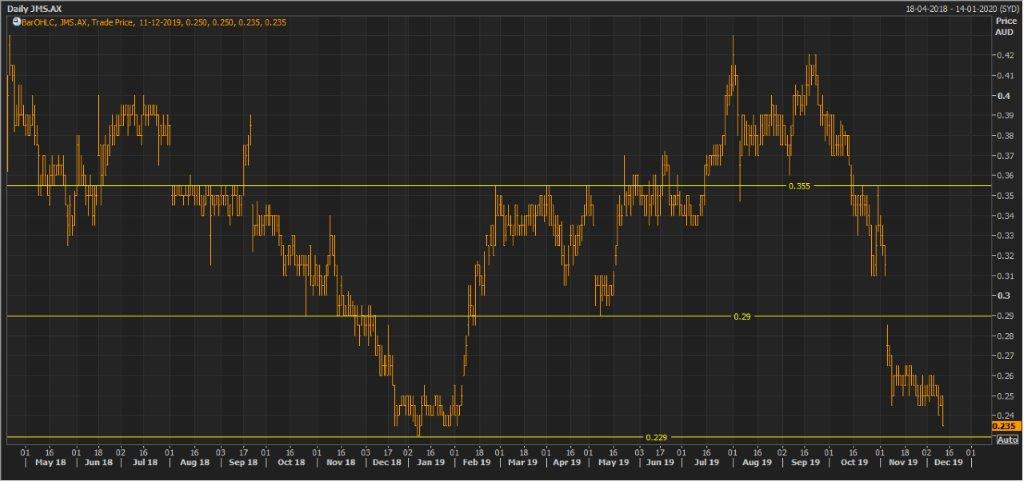
JMS Daily Technical Chart (Source: Thomson Reuters)
Disclaimer
The advice given by Kalkine Pty Ltd and provided on this website is general information only and it does not take into account your investment objectives, financial situation or needs. You should therefore consider whether the advice is appropriate to your investment objectives, financial situation and needs before acting upon it. You should seek advice from a financial adviser, stockbroker or other professional (including taxation and legal advice) as necessary before acting on any advice. Not all investments are appropriate for all people. Kalkine.com.au and associated pages are published by Kalkine Pty Ltd ABN 34 154 808 312 (Australian Financial Services License Number 425376). The information on this website has been prepared from a wide variety of sources, which Kalkine Pty Ltd, to the best of its knowledge and belief, considers accurate. You should make your own enquiries about any investments and we strongly suggest you seek advice before acting upon any recommendation. Kalkine Pty Ltd has made every effort to ensure the reliability of information contained in its newsletters and websites. All information represents our views at the date of publication and may change without notice. To the extent permitted by law, Kalkine Pty Ltd excludes all liability for any loss or damage arising from the use of this website and any information published (including any indirect or consequential loss, any data loss or data corruption). If the law prohibits this exclusion, Kalkine Pty Ltd hereby limits its liability, to the extent permitted by law to the resupply of services. There may be a product disclosure statement or other offer document for the securities and financial products we write about in Kalkine Reports. You should obtain a copy of the product disclosure statement or offer document before making any decision about whether to acquire the security or product. The link to our Terms & Conditions has been provided please go through them and also have a read of the Financial Services Guide. On the date of publishing this report (mentioned on the website), employees and/or associates of Kalkine Pty Ltd do not hold positions in any of the stocks covered on the website. These stocks can change any time and readers of the reports should not consider these stocks as personalised advice.
 Please wait processing your request...