Kalkine has a fully transformed New Avatar.

Company Overview: Jupiter Mines Limited (Jupiter) is an Australia-based Company engaged in the evaluation and exploration interests, as well as the development of steel feed related projects. The Company focuses on exploring iron ore. The Company owns 49.9% interest in Tshipi e Ntle Manganese Mining (Tshipi). Tshipi owns two manganese projects in the Kalahari Manganese fields: Tshipi Borwa and Tshipi Bokone. Tshipi’s project, Tshipi Borwa is developed as a new standalone open-pit manganese mine. Tshipi Borwa is located in the Southern portion of the Kalahari Manganese Field. The Company’s Central Yilgarn Iron Project (CYIP) area is located 130kilometer by road northwest of the town of Menzies. The CYIP Consists of Mount Mason DSO Hematite Project and Mount Ida Magnetite Project.
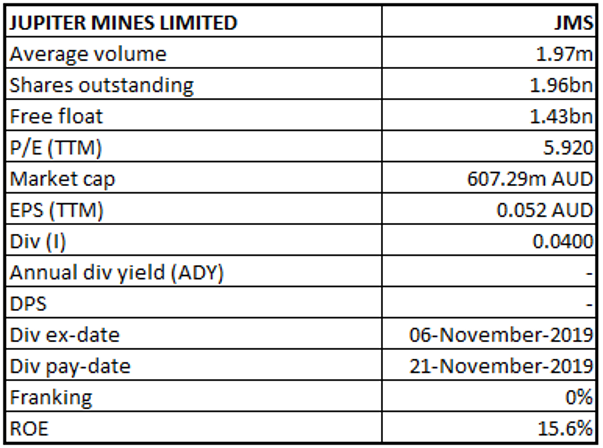
JMS Details
Decent Cash Position at the end of Q3FY20: Jupiter Mines Limited (ASX: JMS) is involved in the operation of the Tshipi Manganese Mine in South Africa and the sale of manganese ore. It has 49.9% beneficial interest in Tshipi é Ntle Manganese Mining Proprietary Limited, which operates the Tshipi Borwa Manganese Mine in the southern portion of the Kalahari manganese field. The company, in FY19, performed well with maintaining tshipi’s position as one of the lowest-cost producers globally. Tshipi Borwa broke their export volume record by shipping 3,511,461 tonnes, with the steady cost of production averaging at USD2.27 per dmtu for FY19, as compared to USD2.09 per dmtu in FY18. This can be attributed to the mechanics of increased royalties as a result of the higher manganese price realised during FY2019. Tshipi paid over ZAR3 billion in dividends to its shareholders and Jupiter, in turn, paid out $147 million, leading to dividend yield of 22%. For the year, JMS’s pay-out ratio exceeded 90%, well above the stated 70% dividend policy. JMS is determined in expanding Tshipi by further increasing its stake in Tshipi and by co-developing the opportunities within the Kalahari manganese field.
Looking at the historical performance, its top-line grew at a CAGR of 87.10% over the period of FY16-19. Total revenue improved from $2 million in FY16 to $13.1 million in FY19. Bottom-line improved from FY16 losses of $172.4 million to a profit of $138 million in FY19. Net income for H1FY20 was reported at $69.2 million as compared to the previous half-year period result of $29.8 million.
Company’s high levels of cash generation supported by continued low operating cost, interest in Tshipi which remains the largest single manganese mine in South Africa and one of the five largest manganese mines globally, decent set of financials along with debt to equity at zero levels, etc., augur well for the future of the business.
.png)
Tshipi Production and Sales since FY2016 (Source: Company Reports)
Q3FY20 Key Highlights for the period ended November 30, 2019:Overall annualised sales for Tshipi remains well on track to meet FY20 target. Tshipi remains cash positive despite a decrease in manganese price due to its low cost of production.
Waste mining witnessed the best results year to date, highlighting positive results from the plans implemented in the month of October 2019, and mining of the barrier pillar remained ahead of target. Overall mining for the year to date remained behind the forecast, mainly due to challenges in the mining such as the mining of a difficult cut, prevailed through the quarter, however it has improved substantially from October onwards. As a result of the increase in ore mining, production in November improved significantly.
Under logistics and sales information, overall sales volumes were slightly ahead of target. Due to some rail issues on one of the routes to port, rail volumes were marginally behind the target, but later the issue was rectified, and regular service was expected to continue from the month of December. With the movement of additional low-grade product, road volumes were slightly ahead.
The Board of Directors of Tshipi declared and paid an interim dividend of ZAR600 million to its shareholders. The dividend for the half-year period was reported at ZAR1.75 billion.
.png)
Quarterly Production, Sales and Financial Information (Source: Company Reports)
H1FY20 Key Highlights for the period ended August 31, 2019: Tshipi provided a dividend of ZAR830 million to Jupiter relating to the first half of FY20 as compared to ZAR948 millon for the previous corresponding period. The decrease can be attributed to the softening of manganese prices. The Jupiter’s Board declared and paid an interim dividend of $0.04 per share and stands on its commitment to distribute almost all cash received from Tshipi with a yield of 12% for its shareholders and payout ratio of over 90%.
The cost of production for the period averaged ZAR31.60 ($3.14) per dmtu (FOB), as compared to ZAR29.38 ($3.03) per dmtu (FOB) in the previous corresponding period.
Tshipi Board has placed their confidence in production volume increase following overhauling of excavators, resolution of drilling inefficiencies and completion of a difficult mining cut. It inked an agreement with South32 Limited (ASX: S32) in June, following which it commenced mining the barrier pillar between the Borwa and Mamatwan pits in August. In the month of September, it also started shipping through the Namibian Port of Lüderitz, opening an additional export route at a similar cost to current routes, leading to high expectation of achieving sales volumes target of 3 million tonnes by FY20..png)
H1FY20 Income Statement (Source: Company Reports)
FY19 Key Highlights for the period ended February 28, 2019:Jupiter South Africa (SA) reported a marketing fee income of $13,116,608 for the financial year 2019 as compared to $10,048,724 in FY18. It sold 1,736,049 tonnes for the year against a budget of 1,596,000 tonnes. Revenue from Tshipi for the period increased from ZAR7.14 billion in FY18 to ZAR10.15 billion in FY19. Profit after taxation improved from ZAR1.90 billion in FY18 to ZAR3.75 billion in FY19. Under balance sheet, trade and other receivables increased from ZAR 882.01 million in FY18 to ZAR1.03 billion in FY19. Inventory for the period was reported at ZAR 0.31 billion, as compared to ZAR 0.38 billion in FY18. Trade and other payables increased from ZAR 0.39 billion in FY18 to ZAR 0.41 billion in FY19. Cash and cash equivalents increased from ZAR 0.21 billion in FY18 to ZAR 0.54 billion in FY19.
.png)
FY19 Income Statement (Source: Company Reports)
Recent Updates:
On January 8, 2020, the company informed the market that its estimated ore reserves (probable ore reserves 52%; proved ore reserves 48%) from the recently completed concept study of the Tshipi Borwa Manganese Mine, is supporting production target of 4.5 million tonnes (Base case Scenario) and related estimated capital expenditure of R1.025 billion. This production profile is an increase of 50% on the current 3 million tonne production level. Major constraints during the concept study included the lack of water in the area, potential mining constraints and logistical constraints in the medium term.
Top 10 Shareholders: The top 10 shareholders have been highlighted in the table, which together form around 42.53% of the total shareholding. APG Asset Management N.V. and AMCI Euro Holdings B.V. hold maximum interests in the company at 12.90% and 7.44%, respectively..png)
Top 10 Shareholders (Source: Thomson Reuters)
A Quick Look at Key Metrics: Its EBITDA margin and net margin for H1FY20 stood at 41.8% and 1103.7%, better than the industry median of 34.0% and 13.1%, respectively, implying decent fundamentals of the company. Its current ratio for H1FY20 stood at 2.8x, better than the industry median of 1.82x, implying the company’s decent liquidity position. Its ROE for H1FY20 stood at 15.6%, better than the industry median of 5.6%, which implies that the company generated a better return for its shareholders than its peer group. Its Return on Invested Capital for H1FY20 stood at 13.9%, better than the previous half-year period return of 6.1%..png)
Key Metrics (Source: Thomson Reuters)
Key Risks: The company is susceptible to certain risks such as fluctuations in the price of manganese ore; fluctuations in the third party contractor costs; reduction in the global demand for steel; risks arising from mining operations being concentrated at one mine; economic, political or social instability in South Africa may affect operations or profits; and a range of other economic, environmental and social sustainability risks faced by all other mining companies in an open economy.
.png)
Key Valuation Metrics (Source: Thomson Reuters)
Valuation Methodology: Price to Earnings (PE) Multiple Approach.png)
Price to Earnings (PE) Multiple Approach (Source: Thomson Reuters)
Note: All forecasted figures and peers have been taken from Thomson Reuters, NTM-Next Twelve Months
Technical Analysis:
Weekly Chart: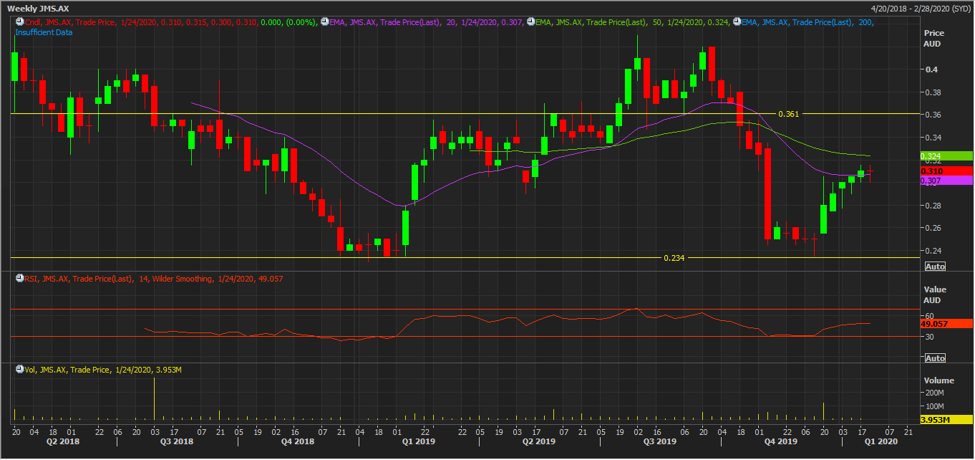
(Source: Thomson Reuters)
On weekly timeframe chart, the stock crossed 20 EMA from below supporting continuation of bull trend, underpinned by bounce back from an important support level of $0.234 few weeks earlier. It is expected to test the resistance level at $0.361, breakout on which it may show further upside potential.
Note: EMA – Exponential Moving Average, RSI – Relative Strength Index
Stock Recommendation: JMS’ share posted a positive one-year return of 29.17%, while in the one-month period the stock generated return of 10.71%. Company’s focus is on delivering tonnes and control costs indicating the cost optimization work in the low manganese price environment. Moreover, its yield of 12% is comparable to other low corporate yields and yield curves globally. Considering the company’s business model, Q3FY20 and H1FY20 performances, recent updates, company outlook and current trading levels, we have valued the stock using a relative valuation method, i.e., and arrived at a lower double-digit growth (in % terms). Hence, we give a “Buy” rating on the stock at the current market price of $0.310 on January 22, 2020.
.jpg)
JMS Daily Technical Chart (Source: Thomson Reuters)
Disclaimer
The advice given by Kalkine Pty Ltd and provided on this website is general information only and it does not take into account your investment objectives, financial situation or needs. You should therefore consider whether the advice is appropriate to your investment objectives, financial situation and needs before acting upon it. You should seek advice from a financial adviser, stockbroker or other professional (including taxation and legal advice) as necessary before acting on any advice. Not all investments are appropriate for all people. Kalkine.com.au and associated pages are published by Kalkine Pty Ltd ABN 34 154 808 312 (Australian Financial Services License Number 425376). The information on this website has been prepared from a wide variety of sources, which Kalkine Pty Ltd, to the best of its knowledge and belief, considers accurate. You should make your own enquiries about any investments and we strongly suggest you seek advice before acting upon any recommendation. Kalkine Pty Ltd has made every effort to ensure the reliability of information contained in its newsletters and websites. All information represents our views at the date of publication and may change without notice. To the extent permitted by law, Kalkine Pty Ltd excludes all liability for any loss or damage arising from the use of this website and any information published (including any indirect or consequential loss, any data loss or data corruption). If the law prohibits this exclusion, Kalkine Pty Ltd hereby limits its liability, to the extent permitted by law to the resupply of services. There may be a product disclosure statement or other offer document for the securities and financial products we write about in Kalkine Reports. You should obtain a copy of the product disclosure statement or offer document before making any decision about whether to acquire the security or product. The link to our Terms & Conditions has been provided please go through them and also have a read of the Financial Services Guide. On the date of publishing this report (mentioned on the website), employees and/or associates of Kalkine Pty Ltd do not hold positions in any of the stocks covered on the website. These stocks can change any time and readers of the reports should not consider these stocks as personalised advice.
 Please wait processing your request...