Kalkine has a fully transformed New Avatar.

Company Overview: Jupiter Mines Limited (Jupiter) is an Australia-based Company engaged in the evaluation and exploration interests, as well as the development of steel feed related projects. The Company focuses on exploring iron ore. The Company owns 49.9% interest in Tshipi e Ntle Manganese Mining (Tshipi). Tshipi owns two manganese projects in the Kalahari Manganese fields: Tshipi Borwa and Tshipi Bokone. Tshipi’s project, Tshipi Borwa is developed as a new standalone open-pit manganese mine. Tshipi Borwa is located in the Southern portion of the Kalahari Manganese Field. The Company’s Central Yilgarn Iron Project (CYIP) area is located 130kilometer by road northwest of the town of Menzies. The CYIP Consists of Mount Mason DSO Hematite Project and Mount Ida Magnetite Project.
.png)
JMS Details
Excellent Top-line CAGR growth for FY16-19: Jupiter Mines Limited (ASX: JMS) is involved in the sale of manganese ore, and it has beneficial interest of 49.9% in Tshipi é Ntle Manganese Mining Proprietary Limited, which operates the Tshipi Borwa Manganese Mine in the southern portion of the Kalahari manganese field in South Africa. The group’s focus is on delivering tonnes and control costs, and its work on cost optimisation initiatives is being supported by the low manganese price environment.
Looking at the historical performance, its top-line grew at a CAGR of 56.21% over the period of FY15-19. Total revenue improved from $2.2 million in FY15 to $13.1 million in FY19. Bottom-line improved from FY15 losses of $32.0 million to a profit of $138 million in FY19.
The Tshipi Borwa mine achieved record sales of 3.5 million tonnes of manganese ore. During the full-year period, Tshipi paid over ZAR 3 billion in dividends to its shareholders, and JMS, in turn, paid out a sum of $147 million as dividends to its shareholders, reflecting a dividend yield of 22% on the year-end share price. Considering the development in infrastructure in the emerging markets, demand for iron ore is expected to rise in the coming times. JMS has maintained a strategic review of its iron ore assets, with a significant intrinsic value which is expected to help the company to boost its earnings and deliver a sustainable return for its shareholders..png)
Historical Performance (Source: Company Reports)
Q3FY20 Key Highlights for the period ended November 30, 2019: As per the release, overall mining for the year to date (YTD) remained behind the forecast, whereas waste mining witnessed the best results for YTD, reflecting positive results from the plans implemented from October’19 onwards. Moreover, despite continued challenges such as mining of a difficult cut, mining of the barrier pillar remained ahead of target. These challenges have softened substantially from October’19 onwards.
Production in the month of November significantly improved as a result of the increase in ore mining, however, high-grade production was slightly behind forecast whereas low-grade production was ahead of target year to date. Tshipi’s cost of production for YTD stood at ZAR31.51/dmtu.
Under Logistics and Sales, overall sales volumes were slightly ahead of target, however, due to some rail issues in one of the routes to port before the December month, rail volumes were marginally behind the target, which was offset by the movement of additional low-grade product.
During the quarter, the Board of Directors of Tshipi paid an interim dividend of ZAR600 million to its shareholders.
The Group’s net consolidated cash balance declined to $43.45 million, as compared to $75.89 million on the previous quarter because of payment of its interim dividend on 21 November 2019 ($0.04 per ordinary share), totaling $78.36 million, offset by the dividend received from Tshipi in September of $28.26 million. JMS’ attributable cash at the end of the November quarter stood at $92.69 million..png)
Quarterly Key Financial Metrics (Source: Company Reports)
H1FY20 Key Highlights for the period ended August 31, 2019: Tshipi provided dividends of ZAR830 million (for H1FY20) to Jupiter, as compared to ZAR948 million in the previous corresponding period. This decrease in dividends can be attributed to a softening of manganese prices. However, Tshipi has maintained high levels of cash generation, underpinned by continued low operating costs.
During the half year period, the cost of production remained steady throughout the period, averaging ZAR31.60 ($3.14) per dmtu FOB (Free on Board), as compared to ZAR29.38 ($3.03) per dmtu FOB in the previous corresponding period. In June, the company signed an agreement with South32 Limited (ASX: S32), after which Tshipi began mining the barrier pillar between the Borwa and Mamatwan pits in August. In the first week of September, Tshipi commenced shipping through the Namibian Port of Lüderitz opening an additional export route at a similar cost to current routes. Moreover, it is determined to achieve the FY2020 overall sales volumes of target of 3 million tonnes.
JMS’ manganese marketing branch in South Africa sold 845,035 dmt, resulting in marketing fee income of ZAR63.1 million ($6.3 million), as compared to ZAR63.1 million ($6.5 million) in the previous corresponding period. Net profit after tax for the period was reported at ZAR30.5 million ($3.0 million), as compared to ZAR55.1 million ($5.7 million) in the previous corresponding period..png)
Half Yearly Key Metrics (Source: Company Reports)
Completion of Concept Study for the Expansion of the Tshipi Borwa Manganese Mine: On January 7, 2020, the company informed the market that the concept study into the expansion of the Tshipi Borwa Manganese Mine is over, and a comprehensive feasibility study will begin shortly. The production profile of 4.5 million tonnes is an increase of 50% on the current 3 million tonne production level. The estimated capital expenditure of R1.025 billion and the production profile is supported by ore reserves (probable ore reserves 52%; proved ore reserves 48%). The concept study emphasized over exploration of the production profiles in excess of the Base Case Scenario, however the infrastructure required is significantly less complex, has a lower capital requirement, will involve a shorter timeframe to implement, there is less reliance on road transport and the legal requirements are significantly more favourable from a timing perspective for the Base Case Scenario. Following the completion of the feasibility study and commercial process, Tshipi via a stepped approach, the company expects to reach steady state exports of 4.5 million tonne in 3 years, with an increase in manganese ore exports in year 2 and year 3.
Top 10 Shareholders: The top 10 shareholders have been highlighted in the table, which together form around 42.55% of the total shareholding. APG Asset Management N.V. and AMCI Euro Holdings B.V. hold maximum interests in the company at 12.90% and 7.44%, respectively. On January 20, 2020, the company’s Director Brian Gilbertson acquired 200,000 shares for the consideration of $61,000.00, effective from January 15, 2020..png)
Top 10 Shareholders (Source: Thomson Reuters)
A Quick Look at Key Metrics: Its EBITDA margin and net margin for H1FY20 stood at 41.8% and 1103.7%, better than the industry median of 36.2% and 14.3%, respectively, implying decent fundamentals of the company. Its current ratio for H1FY20 stood at 2.8x, better than the industry median of 1.82x, implying the company’s decent liquidity position. Its ROE for H1FY20 stood at 15.6%, better than the industry median of 5.9%, which implies that the company generated a better return for its shareholders than its peer group. Its Return on Invested Capital for H1FY20 stood at 13.9%, better than the previous half-year period return of 6.1%..png)
Key Metrics (Source: Thomson Reuters)
Key Risks: The company is susceptible to certain risks such as fluctuations in the price of manganese ore; fluctuations in the third party contractor costs; reduction in the global demand for steel; risks arising from mining operations being concentrated at one mine; economic, political or social instability in South Africa may affect operations or profits; and a range of other economic, environmental and social sustainability risks faced by all other mining companies in an open economy.
.png)
Key Valuation Metrics (Source: Thomson Reuters)
Valuation Methodology: Price to Cash Flow Based Valuation(30).png)
Price to Cash Flow Multiple Based Valuation (Source: Thomson Reuters)
Note: All forecasted figures and peers have been taken from Thomson Reuters, NTM-Next Twelve Months
Technical Analysis:
Weekly Chart:.png)
(Source: Thomson Reuters)
On weekly chart, the stock is trading below the average of its 52-week low and high level of $0.430 and $0.235, respectively. The stochastic oscillator suggests that the stock is entering into an oversold region, indicating build-up of buying opportunity for investors.
Note: EMA – Exponential Moving Average, RSI – Relative Strength Index
Stock Recommendation: JMS’ share posted a negative one-year return of 11.29%, while in the three-months period the stock generated a positive return of 7.84%. Considering the company’s business model, November’19 Quarter results, H1FY20 performances, recent updates and current trading levels, we have valued the stock using Price to Cash Flow based relative valuation method and arrived at a double-digit growth (in % terms). Hence, we give a “Buy” recommendation on the stock at the current market price of $0.275 on February 19, 2020.
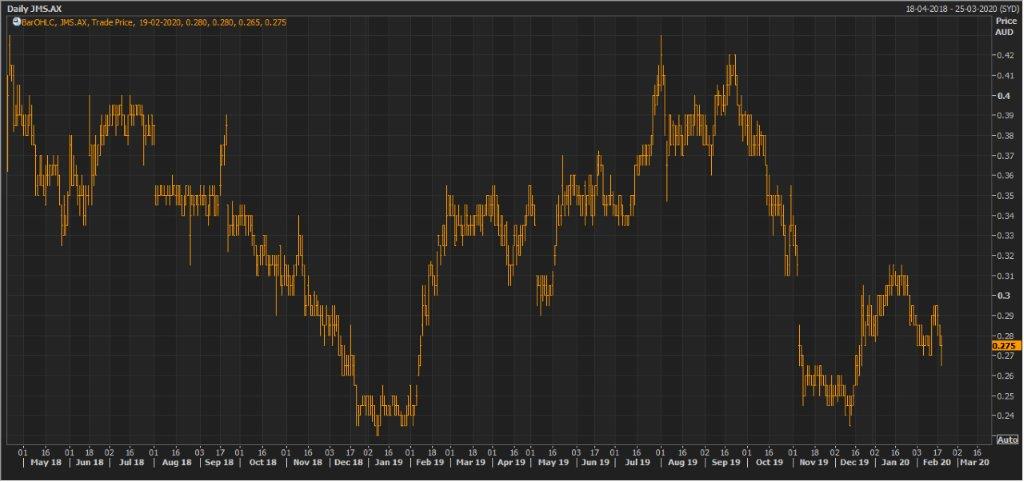
JMS Daily Technical Chart (Source: Thomson Reuters)
Disclaimer
The advice given by Kalkine Pty Ltd and provided on this website is general information only and it does not take into account your investment objectives, financial situation or needs. You should therefore consider whether the advice is appropriate to your investment objectives, financial situation and needs before acting upon it. You should seek advice from a financial adviser, stockbroker or other professional (including taxation and legal advice) as necessary before acting on any advice. Not all investments are appropriate for all people. Kalkine.com.au and associated pages are published by Kalkine Pty Ltd ABN 34 154 808 312 (Australian Financial Services License Number 425376). The information on this website has been prepared from a wide variety of sources, which Kalkine Pty Ltd, to the best of its knowledge and belief, considers accurate. You should make your own enquiries about any investments and we strongly suggest you seek advice before acting upon any recommendation. Kalkine Pty Ltd has made every effort to ensure the reliability of information contained in its newsletters and websites. All information represents our views at the date of publication and may change without notice. To the extent permitted by law, Kalkine Pty Ltd excludes all liability for any loss or damage arising from the use of this website and any information published (including any indirect or consequential loss, any data loss or data corruption). If the law prohibits this exclusion, Kalkine Pty Ltd hereby limits its liability, to the extent permitted by law to the resupply of services. There may be a product disclosure statement or other offer document for the securities and financial products we write about in Kalkine Reports. You should obtain a copy of the product disclosure statement or offer document before making any decision about whether to acquire the security or product. The link to our Terms & Conditions has been provided please go through them and also have a read of the Financial Services Guide. On the date of publishing this report (mentioned on the website), employees and/or associates of Kalkine Pty Ltd do not hold positions in any of the stocks covered on the website. These stocks can change any time and readers of the reports should not consider these stocks as personalised advice.
 Please wait processing your request...