Kalkine has a fully transformed New Avatar.

Company Overview: Kirkland Lake Gold Ltd (ASX: KLA) is a growing, Canadian, U.S. and Australian-listed, gold producer with six wholly-owned operating mines in Canada and Australia. The company’s production is anchored by two high-grade, low-cost underground mining operations- the Macassa mine located in northeastern Ontario, Canada and the Fosterville mine located in the state of Victoria, Australia. The company also owns and operates the Holt Complex, which includes three wholly-owned operating mines, the Taylor mine, Holt mine and Holloway mine, as well as a central milling facility, the Holt mill. The Holt Complex is in northeastern Ontario. Also located in Northern Ontario is the Detour Lake open pit mine, which the company acquired effective January 31, 2020.(1).png)
KLA Details
(1).png)
Decent Top-line Performance for FY15-19: Kirkland Lake Gold Ltd (ASX: KLA) is a growing gold producer operating in Canada and Australia. It produced 974,615 ounces of gold in 2019, with target production for 2020 at 1,470,000 – 1,540,000 ounces. Its production profile is anchored by three high-grade, low-cost operations, including the Fosterville Mine located in the state of Victoria, Australia and the Macassa Mine and Detour Lake Mine, both located in Northern Ontario, Canada.
Looking at the past performance over FY15 to FY19, total revenue of the company has grown at a CAGR (compounded annual growth rate) of 52.08%. Group’s total revenue improved from US$258.0 Mn in FY15 to US$1,380.0 Mn in FY19. The company witnessed a turnaround from a loss of US$2.8 Mn in FY15 to a profit of US$560.1 Mn in FY19.
Under the guidance, the company highlighted three-year production guidance for the Macassa and Fosterville mines, wherein production at Macassa is targeted to increase to over 320,000 ounces by 2022 and well over 400,000 ounces beginning in 2023. Production at Fosterville is expected to maintain the strong production levels in the coming three years, in-line with FY19, as mining continues to advance in the high-grade Swan Zone, with the potential for production to commence from Robbin’s Hill in 2023.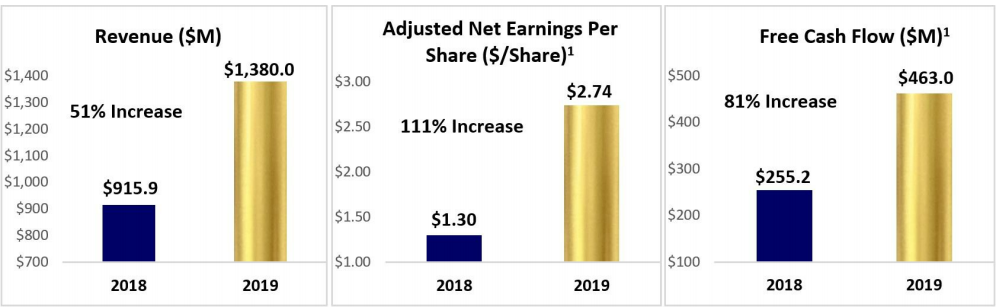
KLA’s Financial Performance for FY19 vs. FY18 (Source: Company Reports)
Q4FY19 Key Highlights for the period ended December 31, 2019: Production for the period was reported at 279,742 ounces, an increase of 21% in the previous corresponding period, and 13% higher than the previous quarter. Operating cash costs for the period averaged $255/oz, as compared to $286/oz in the previous corresponding period, and $287/oz in the previous quarter. All-In Sustaining Costs for the period averaged $512/oz, as compared to $567/oz in the previous corresponding period, and $562/oz in the previous quarter.
Revenue for the period increased by 47% to $412.4 million, as compared to $280.3 million in the previous corresponding period, and an increase of 8% on the previous quarter. Gold sales for the period were reported at 278,438 ounces, an increase of 23% and 9% on previous corresponding period and previous quarter, respectively. Adjusted net earnings for the period came in at $185.3 million, an increase of 76% on the previous corresponding period, and an increase of 11% on the previous quarter.
Net earnings for the period stood at $169.1 million, as compared to $106.5 million in the previous corresponding period, and $176.6 million in the previous quarter. Net cash provided by operating activities for the period was reported at $247.1 million, an increase of 19% on previous corresponding period, and $316.8 million in the previous quarter, this reduction can be attributed to changes in non-cash working capital. Free cash flow for the period was reported at $132.8 million, an increase of 48% on the previous corresponding period. EBITDA for the period was reported at $285.6 million, an increase of 52% on the previous corresponding period, and $296.4 million in the previous quarter. Cash position as on December 31, 2019, was reported at $707.2 million, an increase of 113% from the cash on December 31, 2018. Cash balance as on September 30, 2019, was reported at $615.8 million.
For full-year period, revenue totaled $1,380.0 million, an increase of 51% on previous year. Under the revenue breakdown, $325 million relates to a 36% increase in gold sales, to 979,734 ounces, with higher sales levels at Fosterville accounting for the increase. Remaining revenue number came from the increase of 11% in the average realized gold price, to $1,405 per ounce in FY19, as compared to $1,263 per ounce in FY18. Net earnings in FY19 totaled $560.1 million, as compared to $273.9 million in the previous year. Other than the increase in revenue contributing to decent earnings per share was from the favourable impact over a reduction in expensed exploration costs in FY19 than in FY18. Total exploration and evaluation expenditures (including both expensed and capitalized expenditures) for the period was reported at $159.2 million, an increase of 63% on the previous year.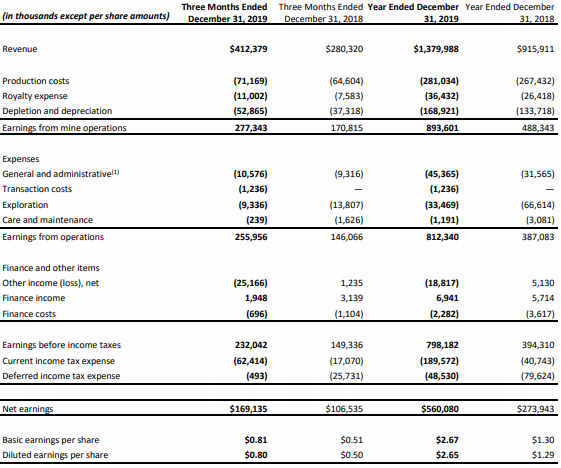
Q4FY19 & FY19 Key Metrics (Source: Company Reports)
Important Updates:
On December 23, 2019, the company announced about the filing of its management information circular and related meeting materials, with a purpose to seek approval in connection with the company’s proposed acquisition of all of the issued and outstanding common shares of Detour Gold Corporation, under Section 192 of the Canada Business Corporations Act. Both the companies entered into an agreement, which guides that KLA will acquire all of the issued and outstanding common shares of Detour Gold on the basis of 0.4343 of a Kirkland Lake Gold common share for each Detour Gold common share held, following which KLA and Detour Gold shareholders will own around 73% and 27% of the outstanding shares of the pro forma company, respectively.
On December 16, 2019, the company announced quarterly dividend payment of US$0.06 per common share, with record date and payment date on December 31, 2019 and January 13, 2020, respectively.
A Quick Look at Key Metrics: Its gross margin, EBITDA margin and net margin for FY19 stood at 64.8%, 71.6% and 40.6%, better than the industry median of 40.5%, 30.7% and 4.3%, respectively, implying decent fundamentals for the company. Its debt to equity multiple for FY19 stood at 0.01x, lower than the industry median of 0.26x.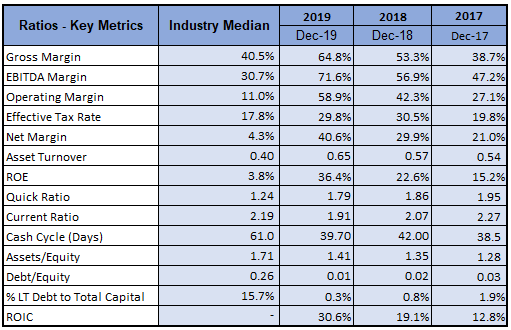
Key Metrics (Source: Thomson Reuters)
Key Risks: The company is susceptible to certain risks such as price of gold, risks associated with exploration and development, health, safety and environmental, foreign operation and political risk, uncertainty in the estimation of mineral resources and mineral reserves, etc.
What to expect: As per the release, consolidated gold production for FY20 has been estimated at around 950,000 - 1,000,000 ounces, unchanged from full-year 2019 guidance. Production at Fosterville in FY20 has been estimated at 590,000 - 610,000 ounces, as compared to actual production for the year of 619,366 ounces. Production guidance at Macassa for FY20 has been estimated in the range of 240,000 - 250,000 ounces, as compared to total production in FY19 of 241,297 ounces. Production at Holt Complex for FY20 has been estimated in the range of 120,000 - 140,000 ounces, as compared to total production in FY19 of 113,952 ounces. Operating cash costs for FY20 has been anticipated in the range of $310 - $320 million, as compared to $278.4 million in FY19. Operating cash costs per ounce sold in FY20 has been anticipated in the range of $300 - $330, as compared to $284 in FY19. AISC per ounce sold for FY20 has been anticipated to be in the range of $570 - $630, as compared to average $564 in FY19, mainly related to higher operating cash costs, an increase in royalty expense resulting from a new royalty applicable to the Fosterville Mine and higher expected corporate G&A expense. Royalty costs for FY20 has been anticipated to be in the range of $58 - $62 million, as compared to total royalty costs of $36.4 million in FY19. Under breakdown of Royalty payments in 2020, around $40 million relate to Fosterville of which ~$24 million results from a new 2.75% royalty introduced by the Victorian Government effective from January 1, 2020. Sustaining capital expenditures for FY20 has been anticipated to be in the range of $165 - $175 million, as compared to $192.4 million in FY19. Growth capital expenditures for FY20 has been anticipated in the range of $70 - $80 million, as compared to $172.1 million in FY19.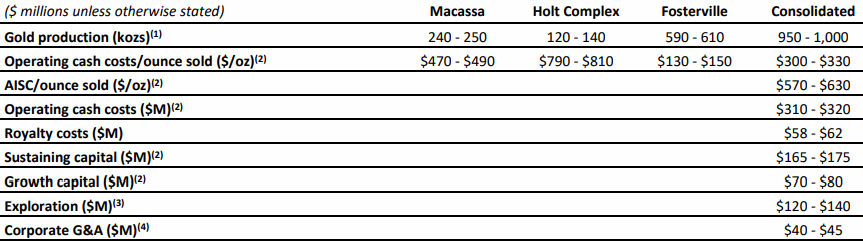
FY20 Guidance (Source: Company Reports)
Gold Outlook: At the time of writing, Gold Spot (XAU/USD) traded at ~US$1484.26 (18:22 (UTC+11)). Rising macro-economic concern over novel-coronavirus (COVID-19) has led to panic like situation among global equity investors, giving edge to yellow metal. On technical analysis front, on monthly chart the gold price is on uptrend, underpinned by gold price trading above 20 EMA, 50 EMA and 200 EMA.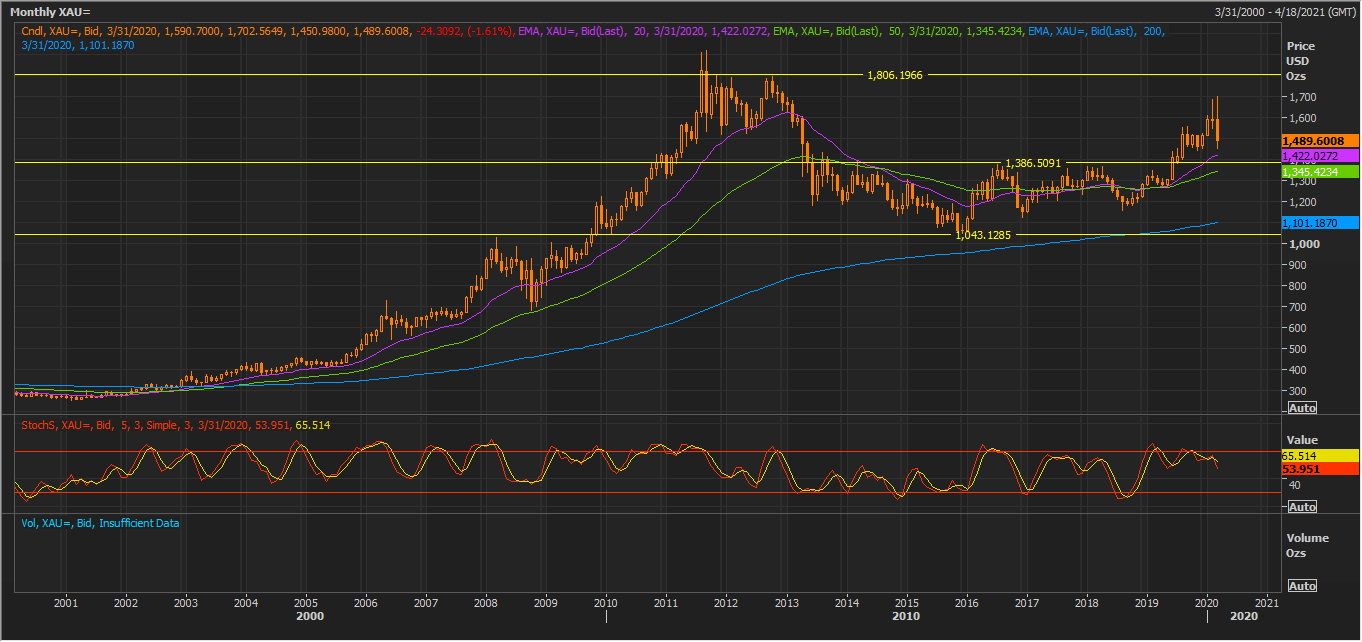
Monthly Chart for Gold Spot Price (XAU/USD) (Source: Thomson Reuters)
Valuation Methodology: Price to Cash Flow Multiple Based Relative Valuation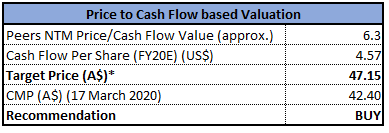
Price to Cash Flow Multiple Approach (Source: Thomson Reuters), * 1 USD = ~1.64 AUD
Note: All forecasted figures and peers have been taken from Thomson Reuters, NTM-Next Twelve Months
Technical Analysis:
Monthly Chart: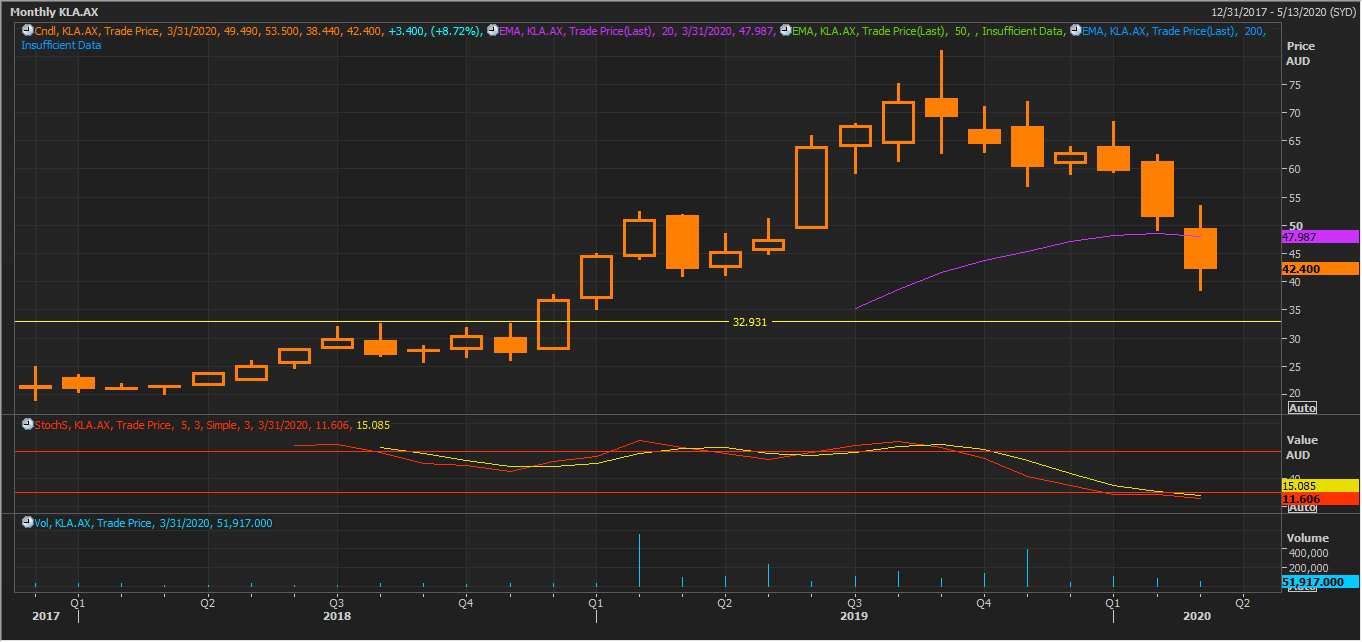
(Source: Thomson Reuters)
Weekly Chart:
(Source: Thomson Reuters)
On both the charts, the stock is trading close to a strong support level of $40.915. As per stochastic oscillator, the stock is in oversold zone, therefore there is a probability for a bounce-back. On any pull-back, the stock is expected to test the level ~$48.03 (Fibonacci Level of 23.6%).
Note: EMA – Exponential Moving Average
Stock Recommendation: KLA’s stock posted a negative one-year return of 18.17%, and in the span of six months, the stock posted a negative return of 37.90%. It is currently trading close to its 52-weeks low price of $38.440, proffering an opportunity for share accumulation. Considering the company’s business operation, December’19 quarter results, FY19 performance, FY20 guidance, gold outlook and current trading levels, we have valued the stock using price to cash flow multiple based relative valuation method and arrived at a target price of higher single-digit growth (in % term). Hence, we give a “Buy” recommendation on the stock at the current market price of A$42.400 per share, up 8.718% on March 17, 2020.
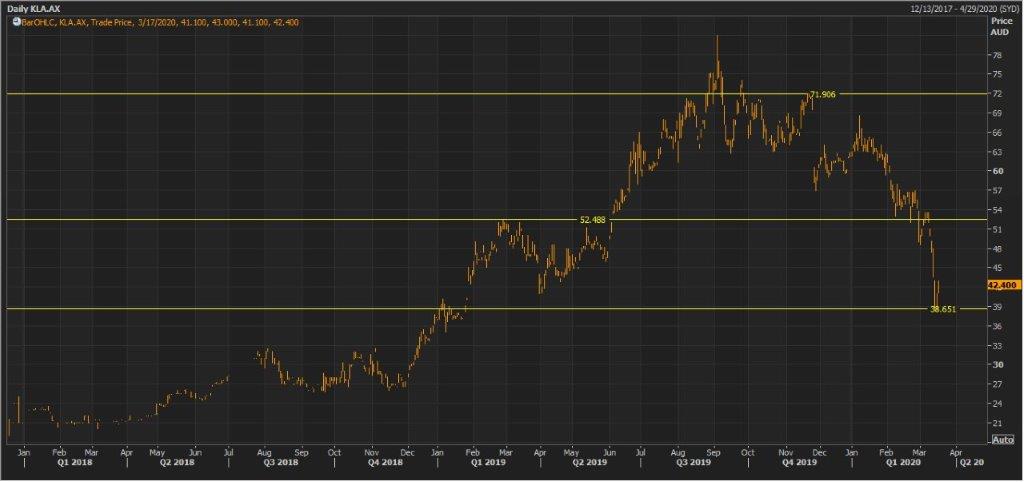
KLA Daily Price Chart (Source: Thomson Reuters)
Disclaimer
The advice given by Kalkine Pty Ltd and provided on this website is general information only and it does not take into account your investment objectives, financial situation or needs. You should therefore consider whether the advice is appropriate to your investment objectives, financial situation and needs before acting upon it. You should seek advice from a financial adviser, stockbroker or other professional (including taxation and legal advice) as necessary before acting on any advice. Not all investments are appropriate for all people. Kalkine.com.au and associated pages are published by Kalkine Pty Ltd ABN 34 154 808 312 (Australian Financial Services License Number 425376). The information on this website has been prepared from a wide variety of sources, which Kalkine Pty Ltd, to the best of its knowledge and belief, considers accurate. You should make your own enquiries about any investments and we strongly suggest you seek advice before acting upon any recommendation. Kalkine Pty Ltd has made every effort to ensure the reliability of information contained in its newsletters and websites. All information represents our views at the date of publication and may change without notice. To the extent permitted by law, Kalkine Pty Ltd excludes all liability for any loss or damage arising from the use of this website and any information published (including any indirect or consequential loss, any data loss or data corruption). If the law prohibits this exclusion, Kalkine Pty Ltd hereby limits its liability, to the extent permitted by law to the resupply of services. There may be a product disclosure statement or other offer document for the securities and financial products we write about in Kalkine Reports. You should obtain a copy of the product disclosure statement or offer document before making any decision about whether to acquire the security or product. The link to our Terms & Conditions has been provided please go through them and also have a read of the Financial Services Guide. On the date of publishing this report (mentioned on the website), employees and/or associates of Kalkine Pty Ltd do not hold positions in any of the stocks covered on the website. These stocks can change any time and readers of the reports should not consider these stocks as personalised advice.
 Please wait processing your request...