Kalkine has a fully transformed New Avatar.

Company Overview: Macmahon Holdings Limited (ASX: MAH) is an ASX listed company offering mining and construction services to miners throughout Australia and internationally. With more than 50 years’ experience in both surface and underground mining, the company has established itself as a contractor of choice for resources projects across a range of locations and commodity sectors. Its core operational activities include surface mining, underground mining, civil works at mine sites (including rehabilitation), and equipment maintenance and management..png)
MAH Details
Increased FY20 Guidance for Revenue and EBIT(A): Macmahon Holdings Limited (ASX: MAH) offers a complete package of mining services to miners throughout Australia and Southeast Asia. Its extensive experience in both surface and underground mining has established the company as the contractor of choice for resources projects across a range of locations and commodity sectors. The company focuses on developing strong relationships with its clients to work in an open, flexible and transparent way to ensure mutually beneficial outcomes whilst also minimising risks for both parties.
Looking at the past performance over FY15 to FY19, total revenue of the company has grown at a CAGR (compounded annual growth rate) of 13.69%. Group’s total revenue improved from $660.2 Mn in FY15 to $1,103.0 Mn in FY19, and net income improved from a loss of $217.9 Mn in FY15 to profit of $46.1 Mn in FY19.
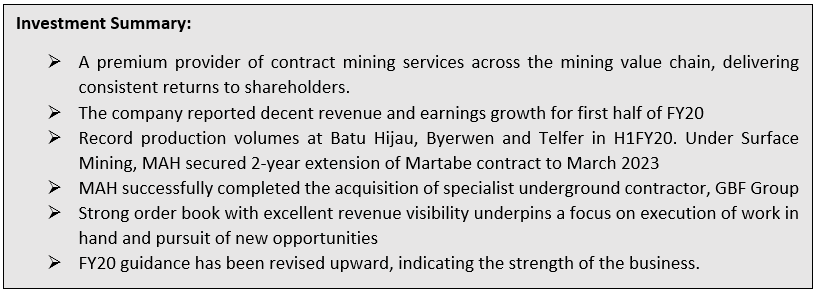
MAH produced a strong first half result and has upgraded its guidance for the full year. During this period, the company completed the GBF acquisition, the appointment of two new non-executive Directors, and the resolution of the Telfer dispute. The integration of GBF is progressing as per the company’s plan, and the opportunities in the business are being capitalized as can be seen from the extension and expansion of contracts with Silver Lake Resources.
With a workforce of more than 7,000 people (including contractors), a solid balance sheet, significant order book of $4.5 billion and tender pipeline of over $7 billion, MAH seems to be well-positioned for further growth..png)
MAH’s Historical Financial Performance (Source: Company Reports)
H1FY20 Key Highlights for the period ended December 31, 2019: Revenue for the period was reported at $686.7 million, an increase of 27% over the previous corresponding period, driven by increased activity across the company’s projects in Australia and Indonesia, the 5-month contribution of the recently acquired underground contractor GBF Group, and successful ramp up at the Boston Shaker project.
Underlying EBITDA for the period was reported at $114.0 million, an increase of 28% on the previous corresponding period (pcp). Underlying EBIT(A) for the period was reported at $44.1 million, which flowed through to a 22% improvement in Statutory Net Profit After Tax of $28.7 million, as compared to $23.6 million in the previous corresponding period.
MAH’s focus on working capital management led to a significant improvement in cash conversion during the period. Operating cash flow (excluding interest, tax and M&A costs) for the period was reported at $90.7 million, and Capital expenditure for the period was reported at $69.9 million.
The company maintained a robust balance sheet position, with gearing of 18.6%, cash on hand of $114.2 million, and net debt of $106.8 million as on December 31, 2019.
The Board of Directors declared an interim dividend (partially franked (30%)) of 0.25 cents per share, following the final dividend of 0.5 cents per share for the full year ended 30 June 2019. The record date and payment date for the dividend are on 17 March 2020 and 2 April 2020, respectively..png)
H1FY20 Income Statement (Source: Company Reports)
Top 10 Shareholders: The top 10 shareholders have been highlighted in the table, which together form around 51.38% of the total shareholding. Perpetual Corporate Trust Ltd. and CPU Share Plans Pty. Ltd. hold maximum interests in the company at 44.27% and 3.05%, respectively..png)
Top 10 Shareholders (Source: Thomson Reuters)
A Quick Look at Key Metrics: Its gross margin H1FY20 stood at 56.8%, better than the industry median of 45.6%. ROE for H1FY20 stood at 6.3%, better than the industry median of 4.7%, implying that the company generated better returns for its shareholders than its peer group.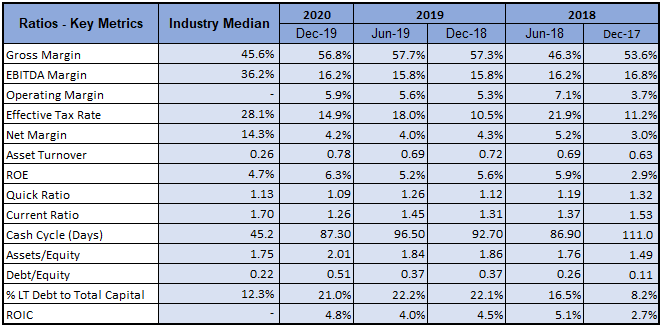
Key Metrics (Source: Thomson Reuters)
Key Risks: The company is susceptible to certain risks such as actions by governments, political events or tax authorities; global economic uncertainty and liquidity; natural catastrophes; climate change; etc.
What to expect: As per the release, the company expects its revenue for full-year to be in the range of $1.3 – $1.4 billion, as compared to the previous range of $1.2 – $1.3 billion. EBIT(A) for the full year has been revised to a range of $85 – $95 million, as compared to the previous range of $80 - $90 million.
A further improvement in cash conversion is expected in the second half of FY20, with its full-year target of 85%. Capex for full year FY20 has been anticipated to increase from $110 million to $155 million to support the growth of existing and new contracts, and the adoption of mining technologies such as automated drills..png)
FY20 Guidance (Source: Company Reports)
Commodity Market Outlook: As per the metal & mining sector report October 2019 at industry.gov.au, sales for electric vehicles (EV) have been forecasted to increase by at least 25% a year over the next 10 years. Electric vehicles use neodymium magnets containing 30% rare earths element. Moreover, EV batteries use lithium, cobalt and rare earths, and demand for lithium battery demand has been forecasted to grow by 25% per year, exceeding 1400 GWh by 2028.
Under renewable energy and energy storage, wind and solar electricity generation use cobalt, manganese and rare earths. Wind and solar generation are projected to account for 35% of generation capacity in 2028.
Australia has the world’s largest resources of rutile (titanium), zirconium (zircon) and tantalum, as well as non-critical minerals such as lead, nickel, uranium, gold and iron ore. Its critical minerals include antimony, cobalt, lithium, magnesite, manganese ore, niobium, tungsten and vanadium, all rank in the top five globally. It ranks among the topmost producer of spodumene (lithium), rutile and zirconium, globally. Moreover, the explored region has been estimated to be merely 20%, with the remaining 80% regions yet to be explored, highlighting the strong long-term potential for resources companies and those which provide equipment and mining services..png)
Data on Australia’s Commodity Sector (Source: industry.gov.au).png)
Key Valuation Metrics (Source: Thomson Reuters)
Valuation Methodology: EV/EBITDA Multiple Based Relative Valuation.png)
EV/EBITDA Multiple Based Relative Valuation (Source: Thomson Reuters)
Note: All forecasted figures and peers have been taken from Thomson Reuters, NTM-Next Twelve Months
Technical Analysis:
Monthly Chart: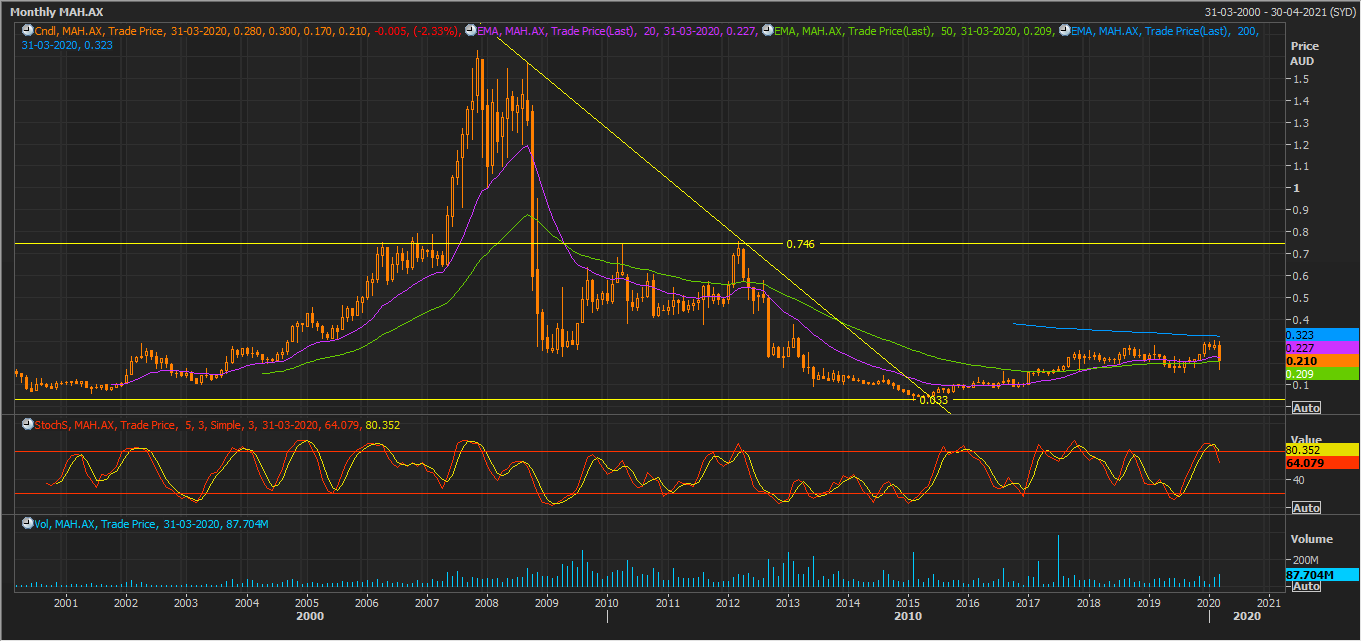
(Source: Thomson Reuters)
Weekly Chart: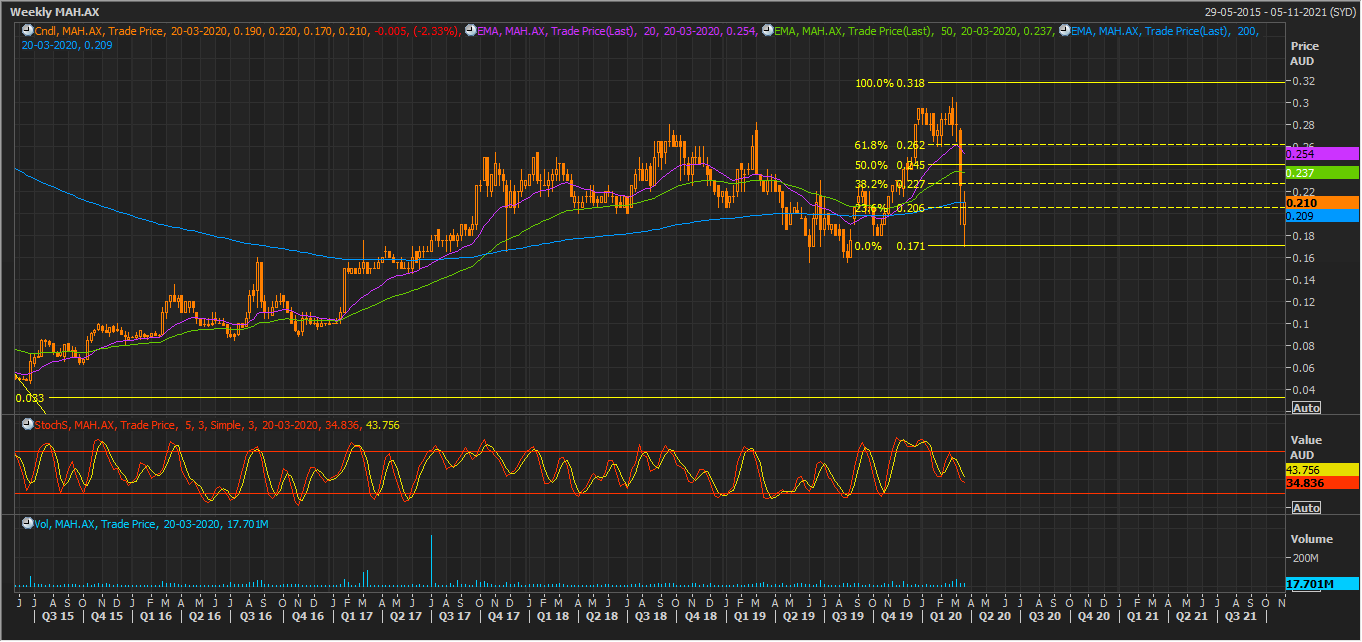
(Source: Thomson Reuters)
On both the charts, the stock appears to be trading in a range bound market, which increases the possibility of a pull-back from the current level. On any bounce back, the stock is expected to test levels around $0.206 (Fibonacci Projection level of 23.6%), break-on which the next challenge can be expected at around $0.227 (Fibonacci Projection level of 38.2%) and third level at around $0.245 (Fibonacci Projection level of 50%)
Note: EMA – Exponential Moving Average
Stock Recommendation: The company’s focus is on optimizing the safe delivery of its order book and converting more of the opportunities in its tender pipeline, underpinned by continuous investment in people, mining technology and ongoing digital transformation. Moreover, the GBF acquisition is expected to assist the company to become more diverse and less capital-intensive business, with greater scale in the underground market. Considering the company’s business operation, first half FY20 results, profitability margins and other financial ratios, FY20 guidance, and current trading levels, we have valued the stock using EV/EBITDA based relative valuation method, and arrived at a target price of double-digit growth (in % term). Hence, we give a “Buy” recommendation on the stock at the current market price of A$0.210 per share, down 2.326% on March 18, 2020.
.jpg)
MAH Daily Technical Chart (Source: Thomson Reuters)
Disclaimer
The advice given by Kalkine Pty Ltd and provided on this website is general information only and it does not take into account your investment objectives, financial situation or needs. You should therefore consider whether the advice is appropriate to your investment objectives, financial situation and needs before acting upon it. You should seek advice from a financial adviser, stockbroker or other professional (including taxation and legal advice) as necessary before acting on any advice. Not all investments are appropriate for all people. Kalkine.com.au and associated pages are published by Kalkine Pty Ltd ABN 34 154 808 312 (Australian Financial Services License Number 425376). The information on this website has been prepared from a wide variety of sources, which Kalkine Pty Ltd, to the best of its knowledge and belief, considers accurate. You should make your own enquiries about any investments and we strongly suggest you seek advice before acting upon any recommendation. Kalkine Pty Ltd has made every effort to ensure the reliability of information contained in its newsletters and websites. All information represents our views at the date of publication and may change without notice. To the extent permitted by law, Kalkine Pty Ltd excludes all liability for any loss or damage arising from the use of this website and any information published (including any indirect or consequential loss, any data loss or data corruption). If the law prohibits this exclusion, Kalkine Pty Ltd hereby limits its liability, to the extent permitted by law to the resupply of services. There may be a product disclosure statement or other offer document for the securities and financial products we write about in Kalkine Reports. You should obtain a copy of the product disclosure statement or offer document before making any decision about whether to acquire the security or product. The link to our Terms & Conditions has been provided please go through them and also have a read of the Financial Services Guide. On the date of publishing this report (mentioned on the website), employees and/or associates of Kalkine Pty Ltd do not hold positions in any of the stocks covered on the website. These stocks can change any time and readers of the reports should not consider these stocks as personalised advice.
 Please wait processing your request...