Kalkine has a fully transformed New Avatar.

Company Overview: OceanaGold Corporation is a gold mining company. The Company is engaged in the exploration, development and operation of gold and other mineral mining activities. The Company's segments are New Zealand, the Philippines, the United States and All other segments. The Company's assets encompass its flagship operation, the Didipio Gold-Copper Mine located on the island of Luzon in the Philippines. On the north island of New Zealand, the Company operates the high-grade Waihi Gold Mine. On the south island of New Zealand, the Company operates the gold mine in the country at the Macraes Goldfield, which is made up of a series of open pit mines and the Frasers underground mine. In the United States, the Company is constructing the Haile Gold Mine, an asset located in South Carolina along the Carolina Slate Belt.
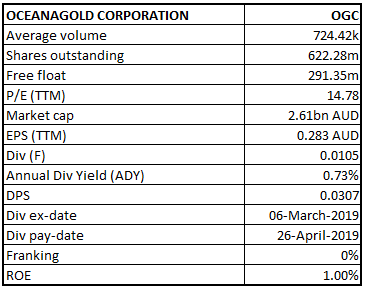
OGC Details
Gold Production at Haile increased by 45% than previous quarter: A mid-tier, high-margin, multinational gold producer OceanaGold Corporation (ASX: OGC) has assets located in the Philippines, New Zealand and the United States. The company recently published its financial and operational results for the second quarter ended on June 30, 2019. It highlighted that its operation, particularly at Haile, had a significant improvement from the previous quarter with the production growth of 45%. Its total material mined at Haile increased by 45% (Q-o-Q) and its unit cash costs decreased by 39%. The company accelerated pre-stripping activities under improved weather conditions at the Red Hill pit during the period, leading to approximately one quarter ahead of schedule. The production at Didipio was broadly in line with the comparative quarters. Its Waihi gold mine recorded higher production in the second quarter which was partially offset by lower production from Macraes where the operation focused on extensive pre-stripping ahead of ore mining in the second half.
In the Philippines, OGC continues to work constructively with regulatory stakeholders on the Financial or Technical Assistance Agreement (FTAA) renewal process. The company will continue to follow due legal process and put employee safety and community welfare first, to secure an injunction against local orders issued by the Provincial Governor seeking to restrain operations at Didipio.
OGC's Performance Metrics (Source: Company Reports)
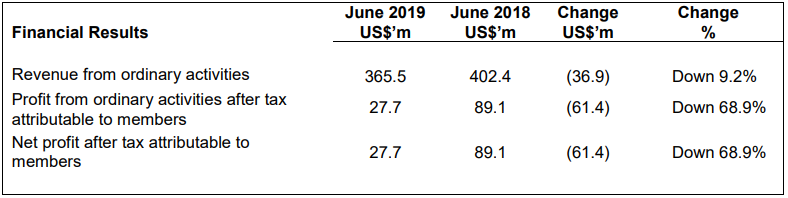
1HFY19 Performance Highlights: For the six months ended on June 30, 2019, revenue decreased by 9.2% to US$365.5 million over the comparative period last year mainly due to lower gold ounces sold, lower copper tons sold, and lower average price received for copper. This is partly offset by a higher average price received for gold. The net profit after tax for the six months ended 30 June 2019 was $27.7 million compared to $89.1 million for the same period in 2018, a decrease of 68.9%. This result was attributable to lower revenue, higher operating costs, higher general & administration, indirect taxes, an unrealised loss on the fair value of undesignated gold hedges compared to an unrealised gain in 2018.
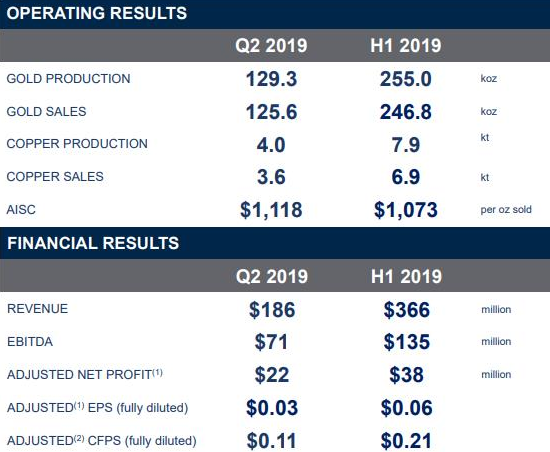
1H19 Financial Snapshot (Source: Company Reports)
Q2FY19 Highlights: The total Gold produced in Q2FY19 was reported at 129.3 koz as compared to 125.7 koz in Q1FY19, an increase of 2.86%. The Gold sales in Q2FY19 was reported at 125.6 koz as compared to 121.1 koz in Q1FY19, which is 3.72% increase. The average Gold price in Q2FY19 was reported at US$1,331 per ounce as compared to US$1,308 per ounce in Q1FY19, which is a 1.76% increase. The total Copper produced during the period was reported at 4 kt as compared to 3.9 kt in the previous quarter. The Copper sales in the period were reported at 3.6 kt as compared to 3.3 kt in the previous quarter. The average Copper price during the quarter was reported at US$2.60 per lb as compared to US$3.12 per lb in the previous quarter.
In Q2FY19, the total ore mined was reported at 2,836 kt as compared to 3,081 kt in the previous quarter. The Gold grade processed during the quarter was reported at 1.40 g/t as compared to 1.41 g/t. The Gold recovery for the quarter was reported at 83.8% as compared to 83.7% in the previous quarter. The cash costs and All-In-Sustaining Costs (AISC) during the period were reported at US$684 per ounce and US$1,118 per ounce, respectively as compared to cash costs of US$688 per ounce and AISC of US$1,026 per ounce in the previous quarter.
Despite total ore mined and processed during the second quarter reduced than the previous quarter, gold production and gold recovery improved in the same period. Its top-line and bottom-line have improved over the previous quarter. With the decent Gold Outlook, OGC is expected to further improve its growth rate in the forthcoming time.
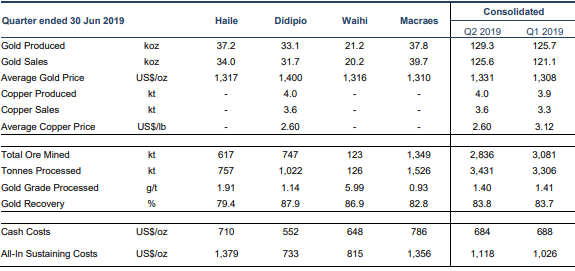
Production and Cost Results Summary (Source: Company Reports)
Top 10 Shareholders: The top 10 shareholders have been highlighted in the table, which together form around 3.08% of the total shareholding. Vanguard Investments Australia Ltd. and J.P. Morgan Asset Management (Hong Kong) Ltd. hold maximum interest in the company at 1.72% and 0.31%, respectively.
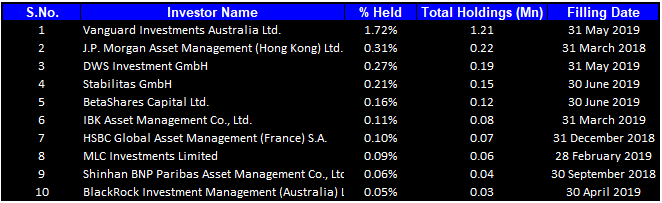
Top 10 Shareholders (Source: Thomson Reuters)
A Quick Look at Key Metrics: Its gross margin, EBITDA margin and net margin for Q2FY2019 stand at 46.4%, 37.6% and 8.2%, better than the industry median of 9.7%, 3.2% and 3.0%, respectively, which implies decent fundamental for the company. Its debt to equity ratio for Q2FY2019 stands at 0.12x, below the industry median of 0.16x, which indicates that company is less leveraged than its peer group, and it utilizes most its own funds to fuel its operations.
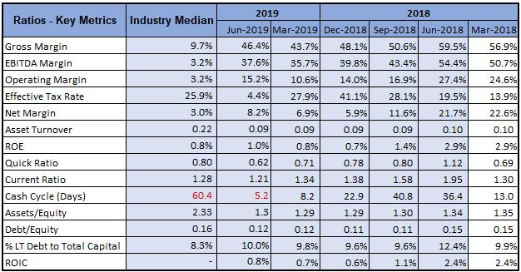
Key Metrics (Source: Thomson Reuters)
TRIFR Reported at 5.0 at the End of Q2FY19: As per health and safety concerns, the company achieved a total recordable injury frequency rate of 3.8 per million work hours in 2Q, down from 4.2 per million hours worked at the end of the previous quarter and 5.0 at the end of the second quarter of 2018. The decrease in the company TRIFR relates to seven fewer recordable injuries across the organisation YTD compared to 2018.
OGC’s Q2 revenue increased by 3.62% than previous quarter: The revenue in Q2FY19 increased by 3.62% to US$186.0 Mn as compared to US$179.5 Mn in Q1FY19. The earnings before interest, tax, depreciation and amortization (EBITDA excluding gain/(loss) on undesignated hedges and impairment charge) for Q2FY19 was reported at US$70.7 Mn, an increase of 9.78% as compared to US$64.4 Mn in Q1FY19. Its Earnings before income tax (excluding gain/(loss) on undesignated hedges and impairment charge) for Q2FY19 was reported at US$25.5 Mn, an increase of 25% as compared to US$20.4 Mn in Q1FY19. Its net profit for Q2FY19 was reported at US$15.3 Mn, which was an increase of 23.39% as compared to US$12.4 Mn.
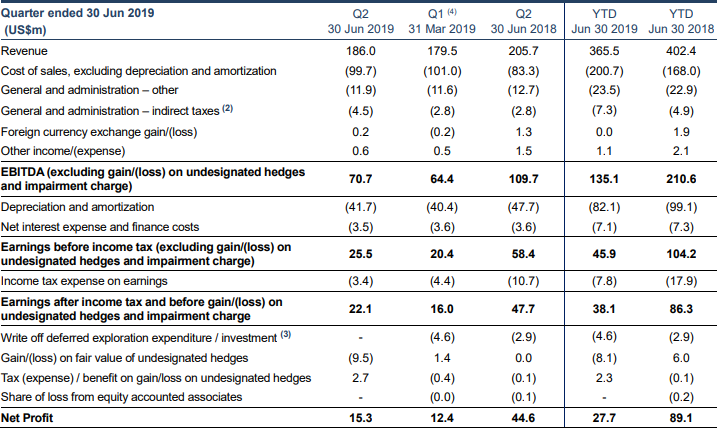
Q2FY19 Financial Metrics (Source: Company Reports)
Cash Balance at the end of Q2FY19 was reported at $84.7 Mn: As per the quarterly cash flow statement, its cash inflows from operating activities in Q2FY19 was reported at US$86.2 Mn, which is an increase of 121.03% as compared to US$39.0 Mn in Q1FY19. The cash outflows from investing activities in Q2FY19 also increased by 31.43%, from US$57.9 Mn in Q1FY19 to US$76.1 Mn in Q2FY19. The cash outflows from the financing activities increased by 288.46% from US$2.6 Mn in Q1FY19 to US$10.1 Mn in Q2FY19. The Cash balance of the company was reported at $84.7 Mn with total available liquidity of $134.7 Mn.
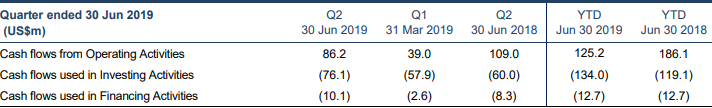
Cash Flow Statement (Source: Company Reports)
Key Risks: The company is vulnerable to risks associated with fluctuations in the gold market price, foreign exchange, etc. Due to climate/weather change or technical issues, the company may not achieve its production estimates, which could have a material adverse effect on any or all its future cash flows, profitability, results of operations and financial condition.
What to expect: At Waihi, the Company commenced development of the Martha Underground with the construction of a raise bore ventilation to connect the two underground drill drives. The raise bore supports the commencement of horizontal development. Over the course of the next twelve months, the Company will complete an all-encompassing pre-feasibility study for the Waihi operation that would include while continuing its resource drilling and mine plans for the Martha Underground.
At Haile, the Company connected the upgraded regrinding circuit to the process plant and continued commissioning the IsaMillTM. With the upgraded regrinding circuit in place, the operation has achieved higher 6 throughput rates and with further refinements to the IsaMillTM, the Company expects to achieve higher recoveries more consistently. Permitting of the larger open pits and the Horseshoe underground at Haile continues to progress well, and the Company expects receipt of these permits by the end of 2019 or early 2020.
At Macraes, the Company has previously stated that through exploration and mine planning, it is seeking to extend the mine life. One of these opportunities is at Golden Point, where the Company is investigating the potential for standalone underground operation.
Gold Outlook: Gold Spot price (XAU/USD) was trading at US$1464.07 as on August 6, 2019 (UTC-4, 11:42 PM). As geo-political tensions are yet to cool-off, global investments in the gold assets are expected to increase in the forthcoming year, leading to further increase in the Gold Spot price.
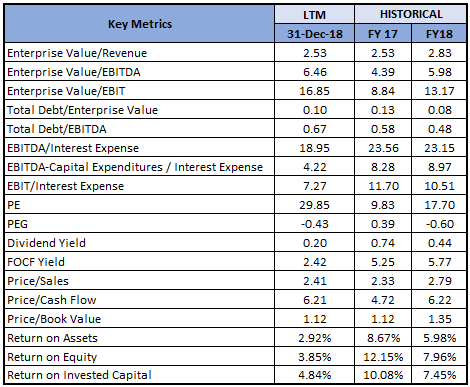
Key Valuation Metrics (Source: Thomson Reuters)
.png)
Stock Recommendation: OGC’s share generated a decent return of 9.40% in the span of three months, while in the span of one-month, it generated a good return of 18.03%. On the backdrop of decent cash position, respectable margins, and ongoing projects, it is expected that the company would be emphasizing over improving its bottom-line performance. Considering the present scenario, decent outlook for gold is likely to help the company to improve its margins further. Looking at the business prospects over the long-term, we have valued the stock using the four-and-half-year average P/E market multiples of 19.7x for FY20E with consensus EPS of $0.22 and have arrived at target price upside of single-digit growth (in %). At CMP of $4.17, the stock of the company is trading at P/E multiple 18.9x of FY20E EPS. Hence, in view of aforesaid parameters and current trading levels, we recommend a “Buy” rating on the stock at the current market price of $4.170 per share, down 0.477 % on August 6, 2019.
.png)
OGC Daily Technical Chart (Source: Thomson Reuters)
Disclaimer
The advice given by Kalkine Pty Ltd and provided on this website is general information only and it does not take into account your investment objectives, financial situation or needs. You should therefore consider whether the advice is appropriate to your investment objectives, financial situation and needs before acting upon it. You should seek advice from a financial adviser, stockbroker or other professional (including taxation and legal advice) as necessary before acting on any advice. Not all investments are appropriate for all people. Kalkine.com.au and associated pages are published by Kalkine Pty Ltd ABN 34 154 808 312 (Australian Financial Services License Number 425376). The information on this website has been prepared from a wide variety of sources, which Kalkine Pty Ltd, to the best of its knowledge and belief, considers accurate. You should make your own enquiries about any investments and we strongly suggest you seek advice before acting upon any recommendation. Kalkine Pty Ltd has made every effort to ensure the reliability of information contained in its newsletters and websites. All information represents our views at the date of publication and may change without notice. To the extent permitted by law, Kalkine Pty Ltd excludes all liability for any loss or damage arising from the use of this website and any information published (including any indirect or consequential loss, any data loss or data corruption). If the law prohibits this exclusion, Kalkine Pty Ltd hereby limits its liability, to the extent permitted by law to the resupply of services. There may be a product disclosure statement or other offer document for the securities and financial products we write about in Kalkine Reports. You should obtain a copy of the product disclosure statement or offer document before making any decision about whether to acquire the security or product. The link to our Terms & Conditions has been provided please go through them and also have a read of the Financial Services Guide. On the date of publishing this report (mentioned on the website), employees and/or associates of Kalkine Pty Ltd do not hold positions in any of the stocks covered on the website. These stocks can change any time and readers of the reports should not consider these stocks as personalised advice.
 Please wait processing your request...