Kalkine has a fully transformed New Avatar.

Cryptocurrency Market Round-Up
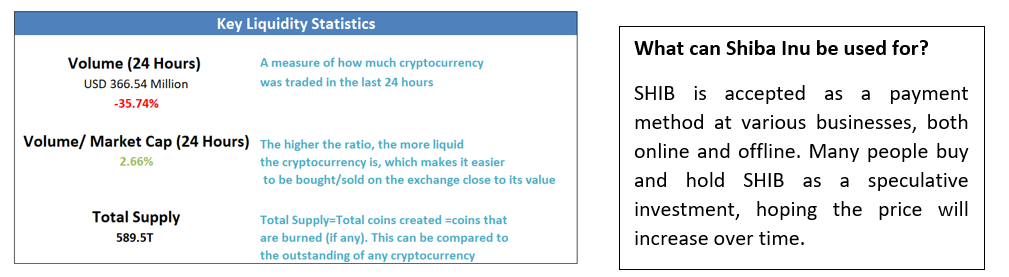
Typically, cryptocurrencies are termed as digital currencies and use blockchain technology to record every transaction. Meme Coins are a category of cryptocurrencies that are typically created as jokes or memes, often with little to no inherent utility or technological innovation. SHIB (Shiba Inu) is a cryptocurrency that has garnered significant attention since its launch in 2020. Originating as an experiment in decentralized community building, it is often referred to as a "meme coin" due to its inspiration from the popular Shiba Inu dog breed, which is also the mascot of the token. SHIB has a market capitalization of ~USD 12.79 billion (as per TradingView as of January 15, 2025).
Last week, the benchmark S&P Cryptocurrency Broad Digital Market (BDM) Index started on a negative note and maintained a bearish momentum for the entire week. The index declined by 360.84 points (~5.82%) to 5840.50 for the week ending January 10, 2025. In the current week starting January 13, 2025, the index is trading with positive momentum. Moreover, other major cryptocurrencies, such as Bitcoin and Ethereum, are witnessing bullish momentum for the current week.
Section 1: Key Performance Indicators:
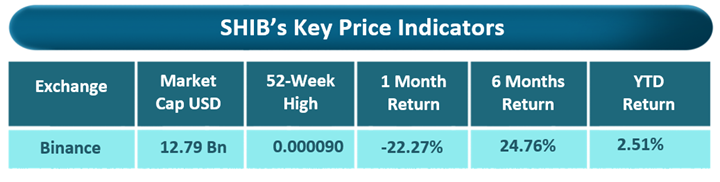
Source: Kalkine Group, Note: Information as on January 15, 2025, 05:30PM Sydney NSW, Australia (GMT+11)
Source: coinmarketcap.com
Section 2: Technical Analysis
The Meme Coins Cryptocurrency Report covers Price Action, Technical Indicators Analysis along with the Resistance and Support Levels, on selected cryptocurrency. Noted below is the illustrative technical score based on technical indicators for Shiba Inu (SHIB):
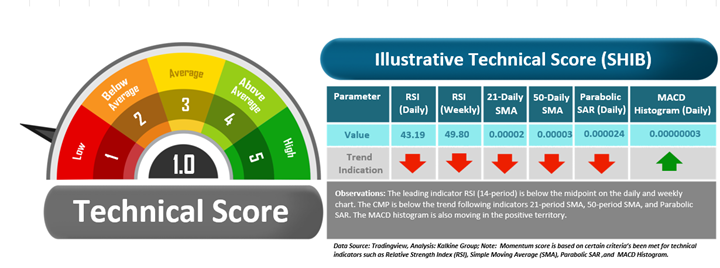
Although the technical momentum score is coming at 1.0, looking at the daily price chart SHIB is currently trading above a major support level, signaling potential upside if it can break through resistance levels. However, risks persist due to market volatility and external factors such as news or macroeconomic events. While there’s room for upside if SHIB holds above support and clears resistance, caution is advised to manage potential risks.
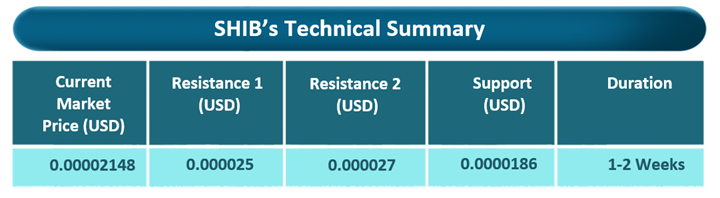
Noted below are the generic insights, support, and resistance levels for the next 1-2 weeks duration for the SHIB:
Resistance & Support Levels as mentioned herein are only indicative in nature as per trend analysis and further evaluation is required when looking at cryptocurrency under discussion.
Note: The reference Information in this report has been sourced from TradingView.
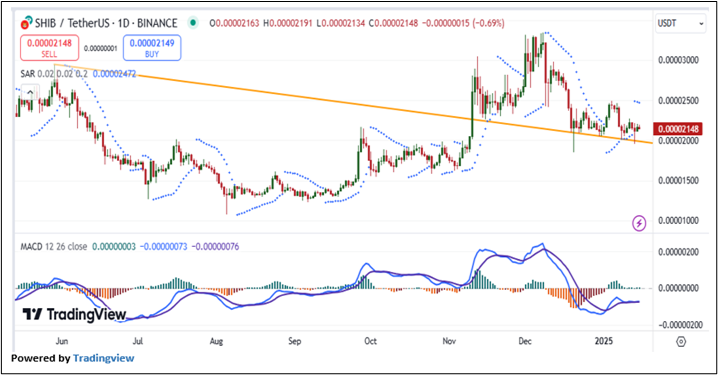
SHIB Technical Analysis Summary (On the Daily Chart):
On the daily chart, SHIB’s prices are trading above the falling trendline support level at the USD 0.000020 level and taking support from the trendline, indicating positive bias in the price action. However, the prices are trading below the trend-following indicator 50-period SMA, which may act as a resistance level. Moreover, the leading indicator RSI (14-period) is showing a reading of ~43.19 level.
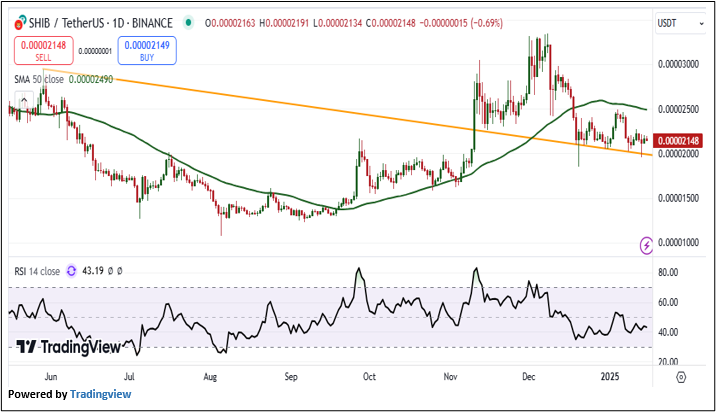
The momentum indicator MACD histogram is trading above the centerline. However, the prices are trading below the Parabolic SAR indicator, which may act as a resistance level. Now the next resistance level appears to be at USD 0.000025, and prices may test this level in the coming sessions (1-2 weeks).
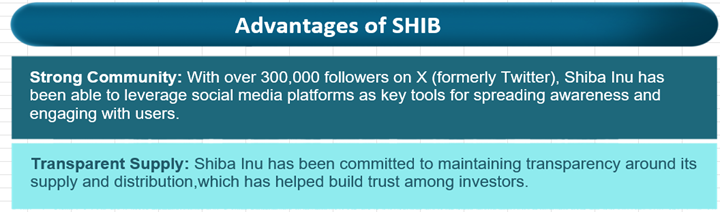
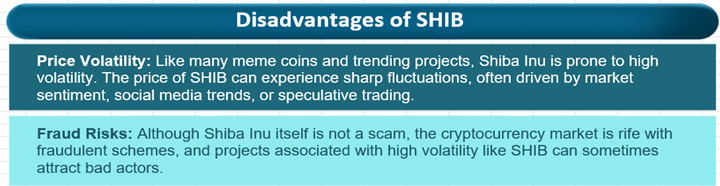
Section 3: Key Advantages and Disadvantages
Disclosures:
Markets are trading in a highly volatile zone currently due to certain macro-economic issues and geopolitical tensions prevailing. Therefore, it is prudent to follow a cautious approach while making investment decisions.
Kalkine reports are prepared based on the crypto prices captured from either REFINITIV or Trading View. Typically, REFINITIV or Trading View may reflect crypto prices with a delay which could be a lag of 25-30 minutes. There can be no assurance that future results or events will be consistent with the information provided in the report. The information is subject to change without any prior notice.
Note 2: How to Read the Chart?
The Green colour line reflects the 21-period simple moving average (SMA) while the red line indicates the 50-period SMA. SMA helps to identify existing price trends and if the prices trade above the 21-period and 50-period SMA, then in general it shows an uptrend trend.
The Black colour line in the chart’s lower segment is a 14-period Relative Strength Index (RSI) which indicates momentum in trend. A reading of 70 or above suggests overbought status, while a reading of 30 or below suggests an oversold status.
The Blue colour bars in the chart’s lower segment show the volume of the Cryptocurrency. The volume is the quantity that changed hands during the given period. Cryptocurrencies with high volumes are more liquid compared to lesser once and higher volumes help in easier and faster execution of the order.
The Orange colour lines are the trend lines drawn by connecting two or more price points and used for trend identification purposes. The trend line also acts as a line of support and resistance.
Technical Indicators Defined: -
Support: A level at which the Cryptocurrency prices tend to find support if they are falling, and a downtrend may take a pause backed by demand or buying interest. Support 1 refers to the nearby support level for the Cryptocurrency and if the price breaches the level, then Support 2 may act as the crucial support level for the Cryptocurrency.
Resistance: A level at which the Cryptocurrency prices tend to find resistance when they are rising, and an uptrend may take a pause due to profit booking or selling interest. Resistance 1 refers to the nearby resistance level for the Cryptocurrency and if the price surpasses the level, then Resistance 2 may act as the crucial resistance level for the Cryptocurrency.
The reference date for all price data, currency, technical indicators, support, and resistance levels is January 15, 2025, at 05:30 PM, (GMT+11) Time in Sydney NSW, Australia. The S&P Cryptocurrency BDM Index in this report has been sourced from REFINITIV.
Abbreviations
CMP: Current Market Price
SMA: Simple Moving Average
RSI: Relative Strength Index
USD: United States dollar
Note: Trading decisions require a thorough analysis by individuals. Technical reports in general chart out metrics that may be assessed by individuals before any Cryptocurrency evaluation. The above are illustrative analytical factors used for evaluating Meme Cryptocurrency; other parameters can be looked at along with additional risks per se. Past performance is neither an indicator nor a guarantee of future performance.
Disclaimer - This report has been issued by Kalkine Pty Limited (ABN 34 154 808 312) (Australian financial services licence number 425376) (“Kalkine”) and prepared by Kalkine and its related bodies corporate authorised to provide general financial product advice. Kalkine.com.au and associated pages are published by Kalkine.
Any advice provided in this report is general advice only and does not take into account your objectives, financial situation or needs. You should therefore consider whether the advice is appropriate to your objectives, financial situation and needs before acting upon it.
There may be a Product Disclosure Statement, Information Statement or other offer document for the securities or other financial products referred to in Kalkine reports. You should obtain a copy of the relevant Product Disclosure Statement, Information Statement or offer document and consider the statement or document before making any decision about whether to acquire the security or product.
Choosing an investment is an important decision. If you do not feel confident making a decision based on the recommendations Kalkine has made in our reports, you should consider seeking advice from a financial adviser, stockbroker or other professional (including taxation and legal advice) before acting on any advice in this report or on the Kalkine website. Not all investments are appropriate for all people.
The information in this report and on the Kalkine website has been prepared from a wide variety of sources, which Kalkine, to the best of its knowledge and belief, considers accurate. Kalkine has made every effort to ensure the reliability of information contained in its reports, newsletters and websites. All information represents our views at the date of publication and may change without notice. The information in this report does not constitute an offer to sell securities or other financial products or a solicitation of an offer to buy securities or other financial products. Our reports contain general recommendations to invest in securities and other financial products.
Any information in this report relating to digital currency or other crypto-asset types (crypto product) is based on the law that applied at the time the report was prepared. Trading in cryptocurrencies involves high risks including the risk of losing some, or all, of your investment amount, and may not be suitable for all investors. Prices of cryptocurrencies are extremely volatile and may be affected by external factors such as financial, regulatory, or political events. The laws that apply to crypto products (and how a particular crypto product is regulated) may change. Investments in crypto products can be high risk and volatile. Therefore, it is prudent to follow a cautious approach while making investment decisions. You should seek appropriate advice and consider your objectives and risk appetite before making any decision in relation to such products.
Kalkine is not responsible for, and does not guarantee, the performance of the investments mentioned in this report. This report may contain information on past performance of particular investments. Past performance is not an indicator of future performance. Hypothetical returns may not reflect actual performance. Any displays of potential investment opportunities are for sample purposes only and may not actually be available to investors. To the extent permitted by law, Kalkine excludes all liability for any loss or damage arising from the use of this report, the Kalkine website and any information published on the Kalkine website (including any indirect or consequential loss, any data loss or data corruption). If the law prohibits this exclusion, Kalkine hereby limits its liability, to the extent permitted by law, to the resupply of services.
Please also read our Terms & Conditions and Financial Services Guide for further information. Employees and/or associates of Kalkine and its related entities may hold interests in the securities or other financial products covered in this report or on Kalkine website. Any such employees and associates are required to comply with certain safeguards, procedures and disclosures as required by law.
Kalkine Media Pty Ltd, an affiliate of Kalkine Pty Ltd, may have received, or be entitled to receive, financial consideration in connection with providing information about certain entity(s) covered on its website including entities covered in this Report.
 Please wait processing your request...