Kalkine has a fully transformed New Avatar.

Company Overview: Perseus Mining Limited is engaged in mining operations and sale of gold, mineral exploration and gold project evaluation and development in the Republics of Ghana, Cote d'Ivoire and Burkina Faso, in West Africa. The Company's segments include Australia, Ghana and Cote d'Ivoire. The Australia segment is engaged in investing activities and corporate management. The Ghana segment is engaged in mining, mineral exploration, evaluation and development activities. The Cote d'Ivoire segment is engaged in mineral exploration, evaluation and development activities. The Company holds over 90% of Edikan Gold Mine (EGM), approximately 90% of Grumesa Gold Project, over 90% of Yaoure Gold Project and approximately 86% of Sissingue Gold Mine. It has commenced exploration at various near-mine prospects, including Bokitsi, Mampong, Pokukrom and the Agyakusu prospecting license. It has also commenced exploration at other prospects in Cote d'Ivoire, including the Mbengue, Mahale and Napie licenses.
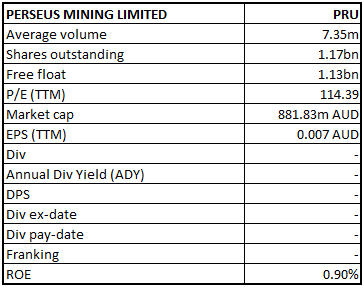
PRU Details
Decent FY19 Top-line and Bottom-line Performance: Perseus Mining Limited (ASX: PRU) is involved in gold production, mineral exploration and gold project development in the Republic of Ghana and the Republic of Côte d’Ivoire, both of which are in West Africa. The group recognizes revenue from gold bullion sales as its obligations are satisfied in accordance with an agreed contract between the group and its customers. Revenue is recognized at a point-in-time when the gold bullion has been credited to the metals account of the customer.
Looking at the historical performance over FY16 to FY19, total revenue of the company has grown with a compound annual growth rate (CAGR) of 26.6%. In FY16, PRU posted a loss after tax of $35.6 Mn, whereas in FY19 the company delivered a profit of $7.6 Mn. Its FY19 production increased by 6% over the previous year, supported by a reduction in average All-In Site cost by 8% over the previous year. Moreover, cash and bullion position at the end of FY19 stood at a remarkable position of $168.3 Mn.
Going forward, the Company is expected to produce 260-300K ounces of gold in its FY20, with AISC of US$800-975 per ounce. Two of its important mines Edikan and Sissingué are expected to deliver decent gold production in the upcoming period. Production at its third gold mine, Yaouré for FY22 has been estimated to be above 200 koz per annum.
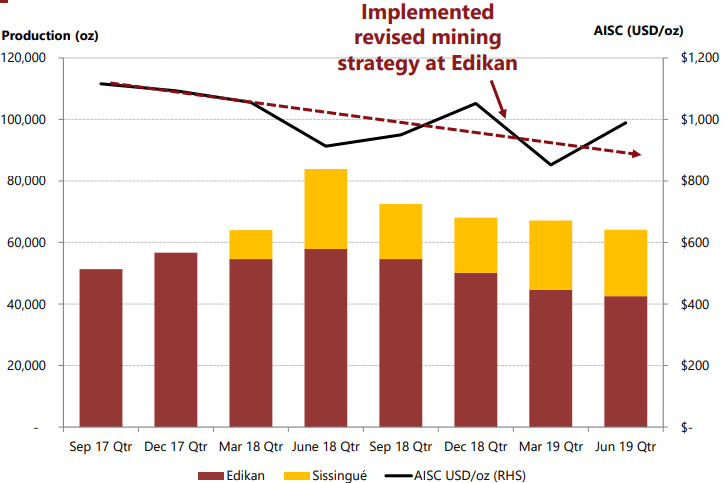
Operating Performance at Edikan and Sissingué gold mines (Source: Company Reports)
FY19 Key Highlights: The group produced a total of 271,824 ounces of gold during the period, which is 6% more than in the preceding twelve months to June 2018. The weighted average all-in site costs (AISC) including the costs of production, royalties and sustaining capital, averaged US$960 per ounce of gold produced, 8% less than in the last financial year. EBITDA from operations increased by 19% to $164.1 Mn, mainly due to decent commercial production at the Sissingué Gold Mine. Additionally, low cost operation with AISC US$746 per ounce, and lower cost per ounce gold production at the Edikan Gold Mine maximized the production of profitable ounces.
Net profit after tax for the period was reported at $7.6 Mn or 0.7 cents per share, compared to a net loss after tax of $24.9 Mn or 2.5 cents per share in the previous year. This improvement was predominantly due to 19% increase in operating EBITDA and 35% increase in revenue, resulting from a 3% higher average gold sales price, and 28% higher gold sales, following a full year of commercial production at Sissingué. Moreover, a foreign exchange gain of $15.5 Mn, compared to a gain of $5.7 Mn in the prior year, mainly due to devaluation of the Australian dollar against the US dollar and revaluation of intercompany loans, along with an income tax benefit of $1.8 Mn, contributed to the result.
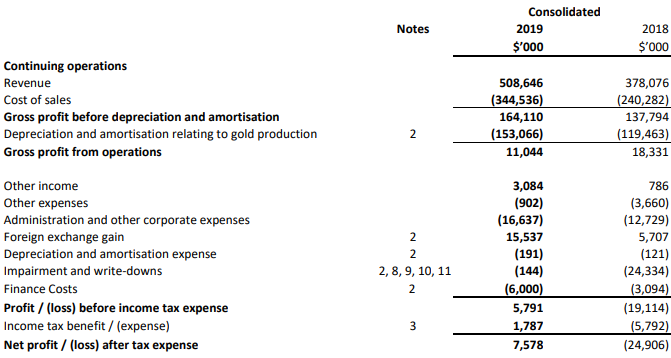
FY19 Income Statement (Source: Company Reports)
FY19 Cash & Bullion Balance Reported at $168.3 Mn: The total value of cash and bullion on hand as on June 30, 2019 was reported at $168.3 Mn, which was $78.5 Mn more than as on June 30, 2018. Operating cash flows at the end of the period increased by $77.9 Mn to $146.2 Mn. Total cash investment during the period stood at $60 Mn, including $24.9 Mn on the development of the Yaouré Gold Mine and $8.6 million on exploration. During the period, borrowings worth $43.8 Mn were repaid, and amount close to $55.7 Mn was received from the exercise of warrants. Company’s net assets as on June 30, 2019 was reported at $783.5 Mn or $0.74 per share after accounting for cash and bullion on hand as well as interest-bearing liabilities of $44.8 Mn.
June’19 Quarter Key Highlights: During the period, the company started development of its third gold mine, Yaouré. Amount close to US$93.5 Mn was committed and around US$11.8 Mn was spent, largely on engineering and procurement of plant and equipment. Mine development remains on target for first gold pour in December 2020. As per the June’19 quarterly report, cash and bullion on hand on June 30, 2019, was reported at US$119.3 Mn, an increase of US$38.5 Mn during the quarter. Outstanding bank debt at the end of the period was reduced by US$13.0 Mn to US$31.5 Mn, taking the net cash and bullion balance to US$87.8 Mn, up 142% during the quarter. In the period, documentation for a new US$150 Mn corporate debt facility was signed, and the first drawdown to refinance existing debt was planned for the September 2019 Quarter.
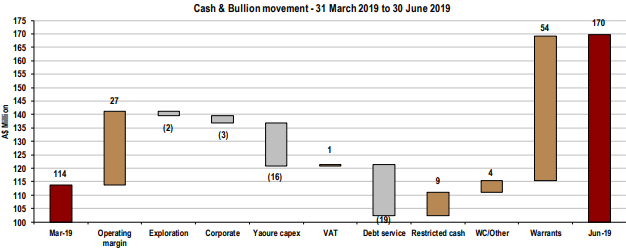
June’19 Quarter Cash and Bullion Data (Source: Company Reports)
June’19 Quarter Gold Price Hedging Strategy: At the end of the quarter, gold forward sales contracts were in place for 54,000 ounces of gold at a weighted average sales price of US$1,290 per ounce. These hedges are designated for delivery progressively over the period up to September 30, 2020.
Top 10 Shareholders: The top 10 shareholders have been highlighted in the table, which together form around 38.98% of the total shareholding. Franklin Advisers, Inc. and Van Eck Associates Corporation hold maximum interest in the company at 8.44% and 5.63%, respectively. Recently, AustralianSuper Pty Ltd ceased to be a substantial holder in the company, effective from September 5, 2019.
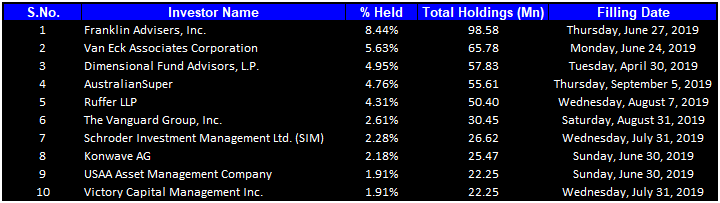
Top 10 Shareholders (Source: Thomson Reuters)
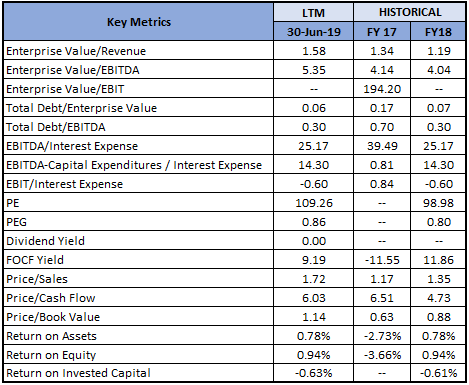
A Quick Look at Key Metrics: Its EBITDA margin for FY19 stood at 29.5%, better than the industry median of 29.1%. Its current ratio for FY19 stood at 3.13x, better than the industry median of 1.87x, which implies that the company is in a better position to address its short-term obligations than its peer group. Debt to equity ratio for FY19 stood at 0.06x, lower than the industry median of 0.11x.
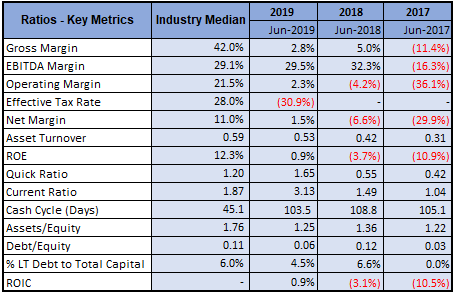
Key Metrics (Source: Thomson Reuters)
Key Risks: The company is susceptible to a variety of risks such as market risks (including currency risk, interest rate risk and price risk), credit risk, liquidity risk and equity price risk. The group uses various methods to measure different types of risk to which it is exposed including sensitivity analysis in the case of interest rate, foreign exchange and other price risks and aging analysis for credit risk. The group then uses derivative financial instruments such as forward metal and forward metal option contracts to hedge certain risk exposures.
What to expect: As per the release, company believes that its financial performance is expected to remain strong with continuing solid gold production and an improving cost structure at its two operating gold mines. Its net cash flow from operations increased by 114% to $146.2 Mn during the year and with cash and bullion on hand valued at $168.3 Mn at the end of the year, along with outstanding debt of $44.8 Mn, indicates that the company is fully funded to pay for the development of its third gold mine, Yaouré which is now expected to produce first gold in December 2020.
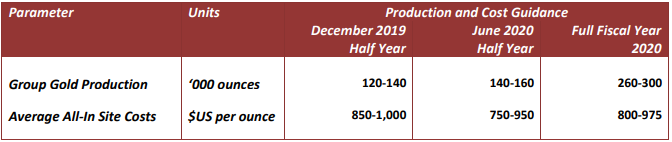
FY20 Production Guidance (Source: Company Reports)
FY20 production at Edikan is expected to be above 200 koz per annum. Production estimate for New mine Yaouré for FY21 is expected to be under 100 koz per annum, whereas production at Yaouré for FY22 has been estimated to be above 200 koz per annum.
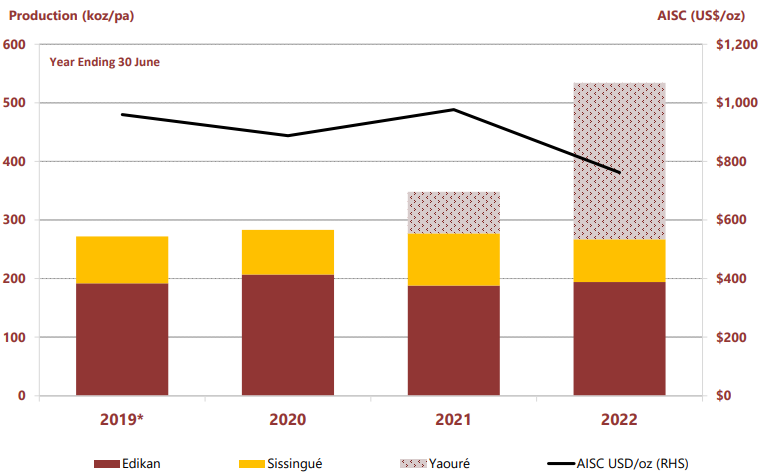
Production Guidance till FY22 for Different Mines (Source: Company Reports)
Key Valuation Metrics (Source: Thomson Reuters)
Valuation Methodology 1: Price to Cash Flow based Valuation
.png)
Price to Cash Flow based Valuation (Source: Thomson Reuters)
Valuation Methodology 2: Enterprise Value to Sales based Valuation
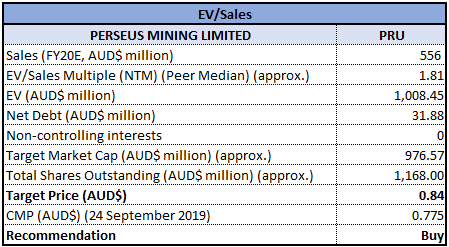
Enterprise Value to Sales based Valuation (Source: Thomson Reuters)
Note: All forecasted figures and peers have been taken from Thomson Reuters, *NTM-Next Twelve Months
Stock Recommendation: The stock price rose by 41.12% in the past six months and was up by around 22.76% in the past three months. The group delivered decent top-line and bottom-line performance in FY19 and the performance is expected to be continued given a positive production guidance for FY20 till FY22. With Yaouré (new gold mine) coming on stream, company’s production levels should be in the order of 500,000 ounces of gold per year, which means that PRU will be in a position to continue to generate material amounts of free cash flow and record significant profits. Looking at the business prospects over the long-term, we have valued the stock using two relative valuation methods, i.e., Price to Cash Flow and Enterprise Value to Sales multiple, and arrived at a target price of high single-digit to low double-digit growth (in % term). Hence, we give a “Buy” recommendation on the stock at the current market price of A$0.775 per share, up 2.649% on 24 September 2019.
.png)
PRU Daily Technical Chart (Source: Thomson Reuters)
Disclaimer
The advice given by Kalkine Pty Ltd and provided on this website is general information only and it does not take into account your investment objectives, financial situation or needs. You should therefore consider whether the advice is appropriate to your investment objectives, financial situation and needs before acting upon it. You should seek advice from a financial adviser, stockbroker or other professional (including taxation and legal advice) as necessary before acting on any advice. Not all investments are appropriate for all people. Kalkine.com.au and associated pages are published by Kalkine Pty Ltd ABN 34 154 808 312 (Australian Financial Services License Number 425376). The information on this website has been prepared from a wide variety of sources, which Kalkine Pty Ltd, to the best of its knowledge and belief, considers accurate. You should make your own enquiries about any investments and we strongly suggest you seek advice before acting upon any recommendation. Kalkine Pty Ltd has made every effort to ensure the reliability of information contained in its newsletters and websites. All information represents our views at the date of publication and may change without notice. To the extent permitted by law, Kalkine Pty Ltd excludes all liability for any loss or damage arising from the use of this website and any information published (including any indirect or consequential loss, any data loss or data corruption). If the law prohibits this exclusion, Kalkine Pty Ltd hereby limits its liability, to the extent permitted by law to the resupply of services. There may be a product disclosure statement or other offer document for the securities and financial products we write about in Kalkine Reports. You should obtain a copy of the product disclosure statement or offer document before making any decision about whether to acquire the security or product. The link to our Terms & Conditions has been provided please go through them and also have a read of the Financial Services Guide. On the date of publishing this report (mentioned on the website), employees and/or associates of Kalkine Pty Ltd do not hold positions in any of the stocks covered on the website. These stocks can change any time and readers of the reports should not consider these stocks as personalised advice.
 Please wait processing your request...