Kalkine has a fully transformed New Avatar.
Section 1: Company Overview and Fundamentals
1.1 Company Overview:
Qualcomm Incorporated (NASDAQ: QCOM) is engaged in the development and commercialization of foundational technologies for the wireless industry, including third generation (3G), fourth generation (4G) and fifth generation (5G) wireless connectivity, and high-performance and low-power computing, including on-device artificial intelligence. Its segments include Qualcomm CDMA Technologies (QCT), Qualcomm Technology Licensing (QTL) and Qualcomm Strategic Initiatives.
Kalkine’s Dividend Income Report covers the Company Overview, Key positives & negatives, Investment summary, Key investment metrics, Top 10 shareholding, Business updates and insights into company recent financial results, Key Risks & Outlook, Price performance and technical summary, Target Price, and Recommendation on the stock.
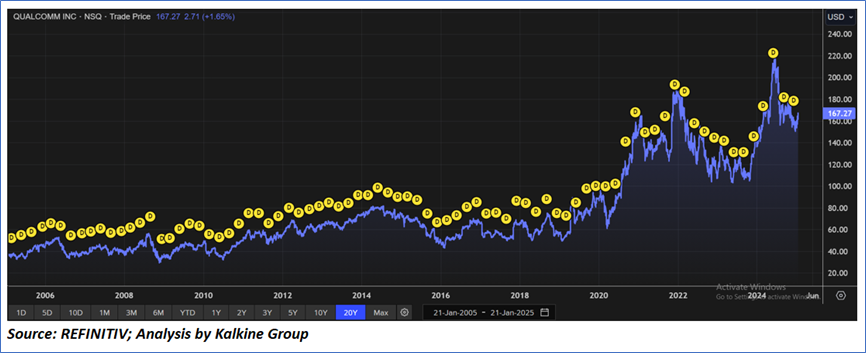
Price Performance:
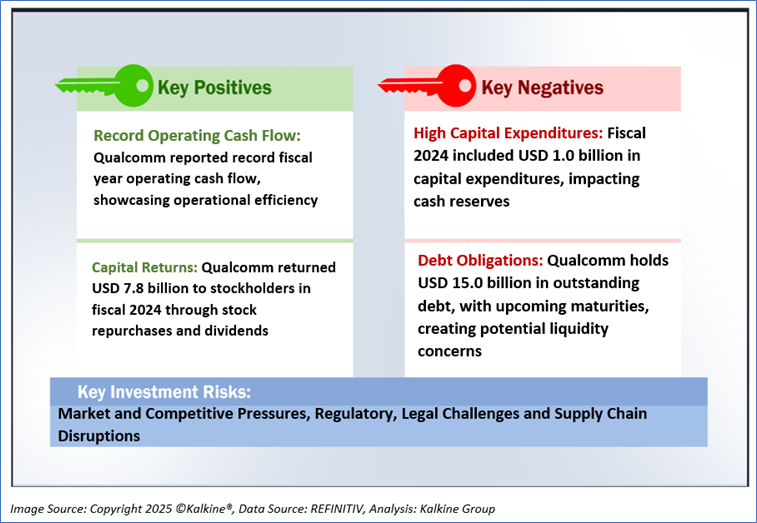
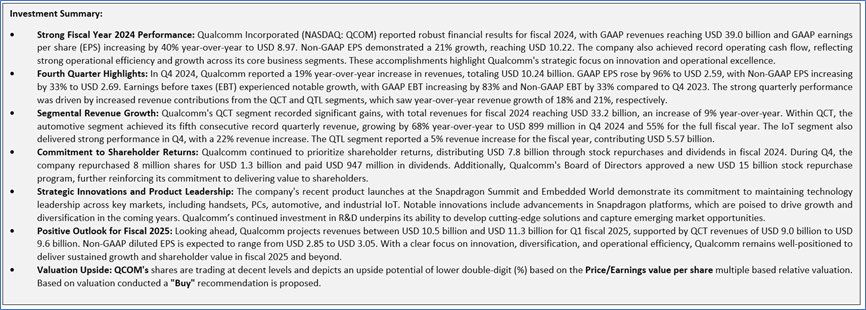
1.2 The Key Positives, Negatives, and Investment summary
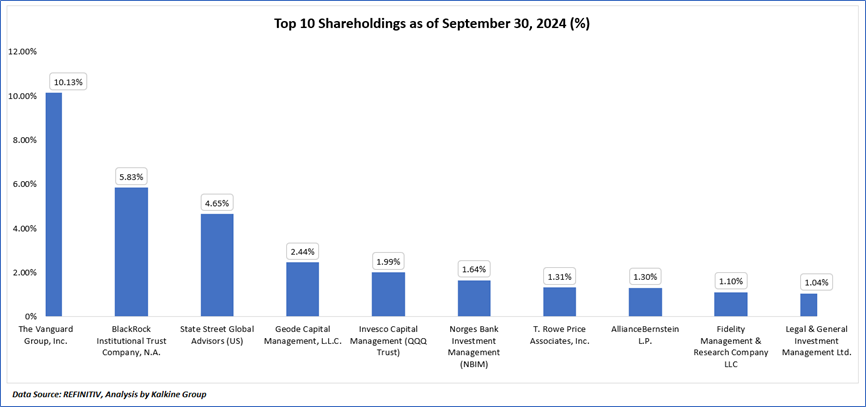
1.3 Top 10 shareholders:
The top 10 shareholders together form ~31.45% of the total shareholding, signifying concentrated shareholding. The Vanguard Group, Inc. and BlackRock Institutional Trust Company, N.A., are the biggest shareholders, holding the maximum stake in the company at ~10.13% and ~5.83%, respectively.
1.4 Dividend payments with impressive dividend yield:
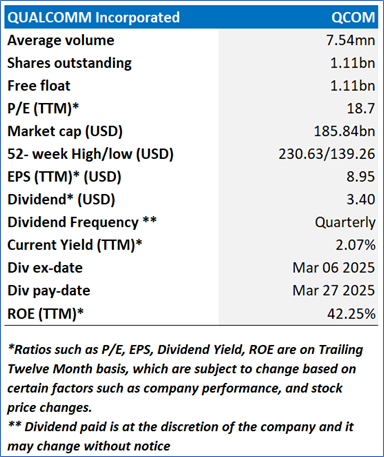
On October 16, 2024, Qualcomm announced a cash dividend of USD 0.85 per share on its common stock, payable on December 19, 2024, to stockholders of record as of December 5, 2024. As of January 21, 2025, Qualcomm's dividend yield stands at 2.03%, reflecting its strong commitment to shareholder returns. Historically, Qualcomm has maintained a consistent dividend policy, with an FY dividend yield of 1.94% and a five-year average yield of 2.14%. The company's payout ratio remains disciplined, with an FY payout ratio of 37.53% compared to its five-year average of 37.49%, ensuring sustainable dividend payments. Qualcomm's coverage ratio further highlights its robust financial health, with an FY ratio of 266.47%, aligning closely with its five-year average of 266.72%. Additionally, the company has demonstrated steady growth in dividends, with a five-year DPS growth of 6.20% and a DPS estimate growth of 1.13%, underlining its focus on enhancing shareholder value. The upcoming interim dividend of USD 0.85 per share, announced on January 17, 2025, is scheduled to have an ex-dividend date of March 6, 2025, and a payment date of March 27, 2025, continuing Qualcomm's strong track record of shareholder-friendly initiatives.
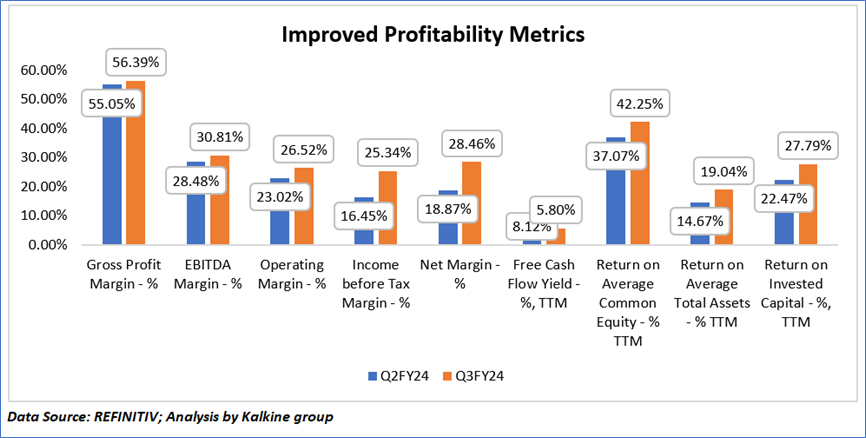
1.5 Key Metrics
Qualcomm's performance from Q2FY24 to Q3FY24 reflects a positive trajectory in key financial metrics, showcasing its robust operational efficiency and profitability. Gross profit margin improved from 55.05% to 56.39%, while EBITDA margin rose from 28.48% to 30.81%, indicating better cost management and higher earnings. The operating margin surged from 23.02% to 26.52%, accompanied by a significant increase in income before tax margin, which leaped from 16.45% to 25.34%, and net margin, which advanced from 18.87% to 28.46%. Furthermore, Qualcomm demonstrated an enhanced return on capital, with return on average common equity climbing from 37.07% to 42.25%, return on average total assets improving from 14.67% to 19.04%, and return on invested capital increasing from 22.47% to 27.79%. These metrics underscore Qualcomm's ability to deliver strong value to shareholders and maintain a competitive edge.
Section 2: Business Updates and Financial Highlights
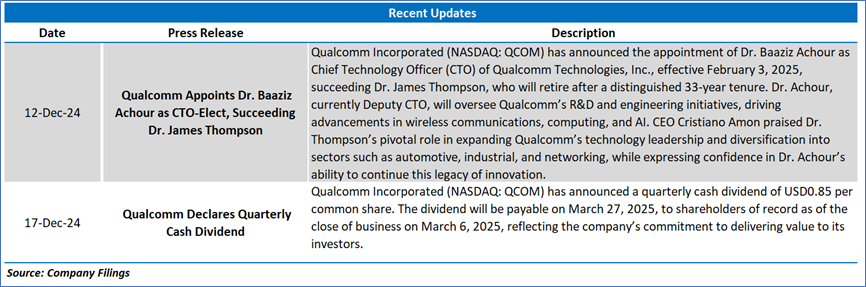
2.1 Recent Updates:
The below picture gives an overview of the recent updates:
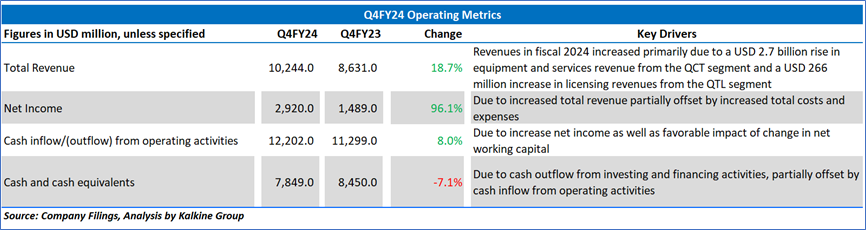
2.2 Insights of Q4FY24:
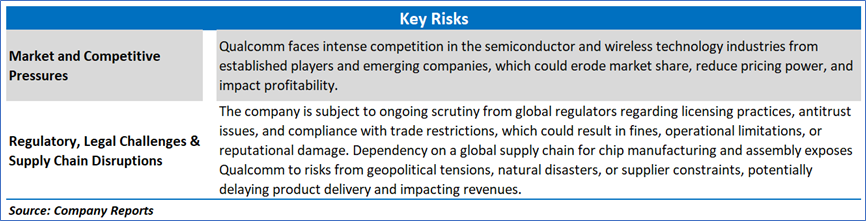
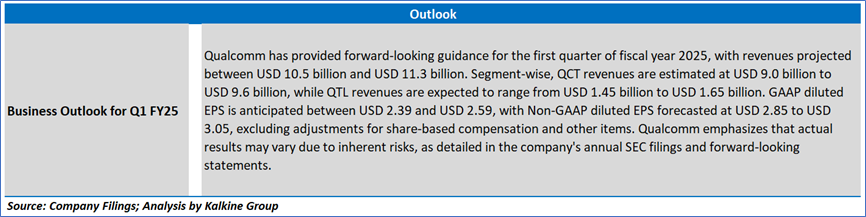
Section 3: Key Risks and Outlook:
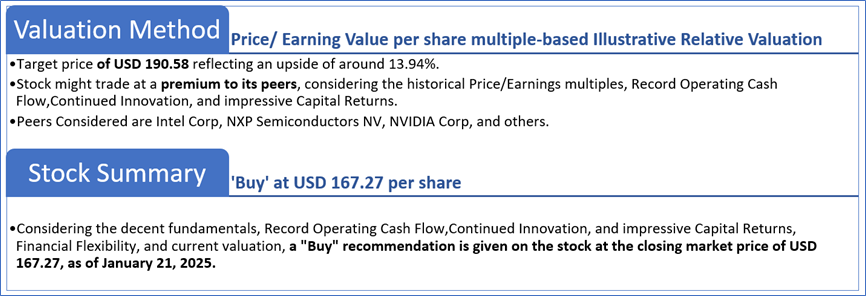
Section 4: Stock Recommendation Summary:
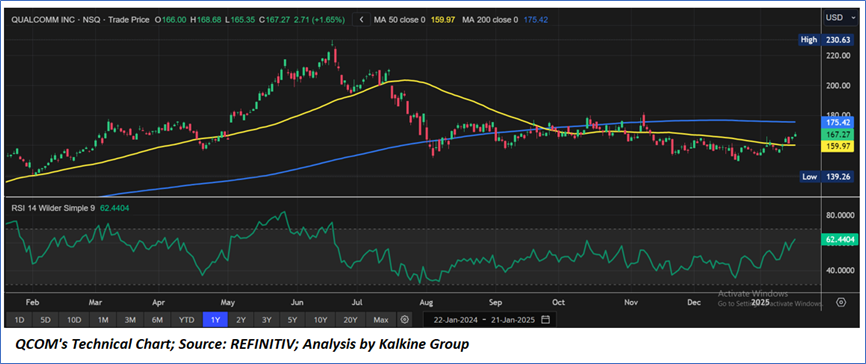
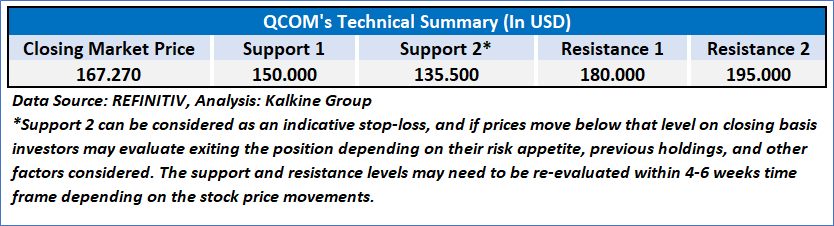
4.1 Technical Summary:
Price Performance:
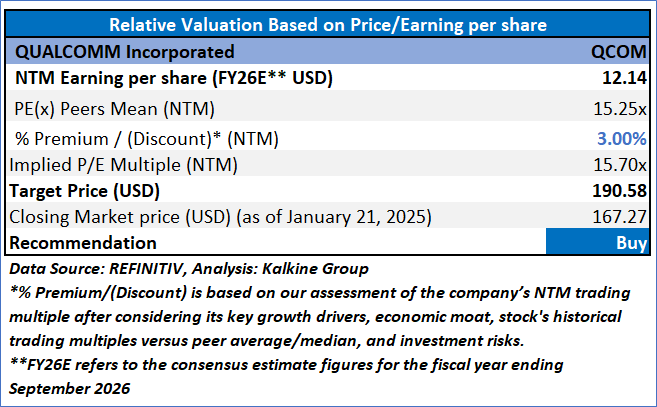
4.2 Fundamental Valuation
Valuation Methodology: Price/Earnings Per Share Multiple Based Relative Valuation
Markets are trading in a highly volatile zone currently due to certain macroeconomic issues and geopolitical tensions prevailing. Therefore, it is prudent to follow a cautious approach while investing.
Note 1: Past performance is not a reliable indicator of future performance.
Note 2: The reference date for all price data, currency, technical indicators, support, and resistance levels is January 21, 2025. The reference data in this report has been partly sourced from REFINITIV.
Note 3: Investment decisions should be made depending on an individual's appetite for upside potential, risks, holding duration, and any previous holdings. An 'Exit' from the stock can be considered if the Target Price mentioned as per the Valuation and or the technical levels provided has been achieved and is subject to the factors discussed above.
Note 4: The report publishing date is as per the Pacific Time Zone.
Technical Indicators Defined: -
Support: A level at which the stock prices tend to find support if they are falling, and a downtrend may take a pause backed by demand or buying interest. Support 1 refers to the nearby support level for the stock and if the price breaches the level, then Support 2 may act as the crucial support level for the stock.
Resistance: A level at which the stock prices tend to find resistance when they are rising, and an uptrend may take a pause due to profit booking or selling interest. Resistance 1 refers to the nearby resistance level for the stock and if the price surpasses the level, then Resistance 2 may act as the crucial resistance level for the stock.
Stop-loss: It is a level to protect against further losses in case of unfavorable movement in the stock prices.
This report has been issued by Kalkine Pty Limited (ABN 34 154 808 312) (Australian financial services licence number 425376) (“Kalkine”) and prepared by Kalkine and its related bodies corporate authorised to provide general financial product advice. Kalkine.com.au and associated pages are published by Kalkine.
Any advice provided in this report is general advice only and does not take into account your objectives, financial situation or needs. You should therefore consider whether the advice is appropriate to your objectives, financial situation and needs before acting upon it.
There may be a Product Disclosure Statement, Information Statement or other offer document for the securities or other financial products referred to in Kalkine reports. You should obtain a copy of the relevant Product Disclosure Statement, Information Statement or offer document and consider the statement or document before making any decision about whether to acquire the security or product.
Choosing an investment is an important decision. If you do not feel confident making a decision based on the recommendations Kalkine has made in our reports, you should consider seeking advice from a financial adviser, stockbroker or other professional (including taxation and legal advice) before acting on any advice in this report or on the Kalkine website. Not all investments are appropriate for all people.
The information in this report and on the Kalkine website has been prepared from a wide variety of sources, which Kalkine, to the best of its knowledge and belief, considers accurate. Kalkine has made every effort to ensure the reliability of information contained in its reports, newsletters and websites. All information represents our views at the date of publication and may change without notice. The information in this report does not constitute an offer to sell securities or other financial products or a solicitation of an offer to buy securities or other financial products. Our reports contain general recommendations to invest in securities and other financial products.
Kalkine is not responsible for, and does not guarantee, the performance of the investments mentioned in this report This report may contain information on past performance of particular investments. Past performance is not an indicator of future performance. Hypothetical returns may not reflect actual performance. Any displays of potential investment opportunities are for sample purposes only and may not actually be available to investors. To the extent permitted by law, Kalkine excludes all liability for any loss or damage arising from the use of this report, the Kalkine website and any information published on the Kalkine website (including any indirect or consequential loss, any data loss or data corruption). If the law prohibits this exclusion, Kalkine hereby limits its liability, to the extent permitted by law, to the resupply of services..
Please also read our Terms & Conditions and Financial Services Guide for further information. Employees and/or associates of Kalkine and its related entities may hold interests in the securities or other financial products covered in this report or on the Kalkine website. Any such employees and associates are required to comply with certain safeguards, procedures and disclosures as required by law.
Kalkine Media Pty Ltd, an affiliate of Kalkine Pty Ltd, may have received, or be entitled to receive, financial consideration in connection with providing information about certain entity(s) covered on its website including entities covered in this Report.
 Please wait processing your request...