Kalkine has a fully transformed New Avatar.

Company Overview: Ramelius Resources Limited is engaged in exploration, mine development, mine operations, the sale of gold and milling services. The Company's segments include Mt Magnet, Burbanks and Exploration. The Company's operational projects include Mt Magnet Mine, Kathleen Valley Mine and Vivien Mine. Its development projects include Blackmans and Water Tank Hill. Its exploration projects include Milkyway, Boorgardie Basin and Tanami Joint Venture Gold Project. The Mt Magnet gold project is located adjacent to the town of Mt Magnet, approximately 500 kilometers north-east of Perth in the Murchison Goldfield of the Western Australian Yilgarn Craton. The Blackmans gold project is located approximately 30 kilometers north of Mt Magnet, in Western Australia. The Water Tank Hill project lies over 1.5 kilometers west of Mt Magnet, in Western Australia. The Milkyway gold project is located approximately 3.6 kilometers southwest of the processing plant at Mt Magnet, Western Australia..png)
RMS Details
Improvement in RMS’ Financial Performance for FY15-19: Ramelius Resources Limited (ASX: RMS) owns and operates the Mt Magnet, Edna May, Vivien and Marda gold mines, and has around 90% stake in the Tampia Hill gold project, all in Western Australia. Under the operations, ore from the high-grade Vivien underground mine is trucked to the Mt Magnet processing plant where it is blended with ore from both underground and open pit sources. Its Edna May operation (purchased from Evolution mining) currently processes ore from its underground operations and hauled ore from the Marda gold mine. Additionally, the decision-to-mine at its Tampia gold project is expected in the March quarter of 2020.
Looking at the past performance over FY15 to FY19, total revenue and net income of the company have grown with a CAGR (compounded annual growth rate) of 28.25% and 7.87%, respectively. Group’s total revenue improved from $130.4 Mn in FY15 to $352.8 Mn in FY19, and net income improved from $16.1 Mn in FY15 to $21.8 Mn in FY19.
The company in the month of June 2019 announced a landmark five-year life of mine plan considering the twin production centres of Mt Magnet and Edna May, where it envisaged production in excess of 1,000,000 ounces of gold over the next five years. During FY19, the company produced 196,679 ounces from its Mt Magnet, Vivien, and Edna May gold mines at an All-In Sustaining Cost (AISC) of A$1,192 per ounce. The company has estimated improved production of 205 - 225,000 ounces at an AISC of A$1,225 - 1,325/oz for the financial year 2020..png)
Historical Performance of RMS for FY15-19 (Source: Company Reports)
Key Highlights of December’19 Quarter: Group’s gold production for the period was reported at 47,902 ounces at All-In Sustaining Cost (AISC) of A$1,245/oz, where gold production at Mt Magnet (incl. Vivien) and Edna May were reported at 37,956 ounces at an AISC of A$1,182/oz and 9,946 ounces at an AISC of A$1,512/oz, respectively. Cash & gold value position as on December 31, 2019 was reported at A$87.7 million, following a dividend payment of A$6.6 million and capital, development and exploration expenditure of A$29.5 million. Total revenue for the period was reported at A$85.8 million from an average gold price of A$1,874/oz.
Production for the six months to December 2019 was reported at 92,084oz at an AISC of A$1,240/oz..png)
December’19 Quarter production & Financial summary (Source: Company Reports)
Hedging Strategy:
On December 31, 2019, forward gold sales comprised 239,150 ounces of gold at an average price of A$1,943/oz, over the period January 2020 to May 2022. During the Quarter, the company entered into new contracts totaling 34,750 ounces at A$2,168/oz, following delivery of contracts for 38,250 ounces at A$1,815/oz.
The company implemented an additional forward sale during the month of January, over the continued strength in the AUD Gold price. The total hedge book for the company comprised 272,000 ounces of gold at $2,015 per ounce..png)
Hedge Book Summary (Source: Company Reports)
FY19 Key Financial Highlights for the period ended June 30, 2019: Revenue for the full year increased by 3% to $352.8 million, as compared to $341.8 million in the previous year. This can be attributed to an improved gold price environment with lower production from Mt Magnet, offset by increased production at Edna May. Additionally, Silver & other sales increased from $0.8 million in 2018 to $1.8 million in 2019, which was mainly due to the sale of equipment at Edna May as the mine moved towards a contractor model when operations focused on the underground development.
The Earnings before interest & tax (EBIT) for the full year was reported at $30.7 million, a decline of 34% on the previous year. Net profit after income tax for the period was reported at $21.8 million, a decrease of 29% from the previous year. Net cash from operations for the year was reported at $137.0 million, as compared to $118.9 million on the previous year, mainly due to the monetisation of ore stockpiles and gold on hand that was accumulated in the prior year. During the year, the company re-invested amount of $109.0 million in total, which comprised payments for the Tampia Gold Project (Explaurum Limited), payments for the Marda Gold Project (Black Oak Minerals Limited), payments for the development of open pit and underground mines and payments for mining tenements and exploration at $8.4 million, $13.2 million, $58.2 million and $19.0 million, respectively. Free cash flow for the year was reported at $51.8 million, as compared to $34.9 million in the previous year. Cash on hand at the end of FY19 was reported at $95.8 million as compared to $68.2 million at the end of the previous year..png)
FY19 Income Statement (Source: Company Reports)
Recent Updates:
Ramelius to Acquire Spectrum Metals: On February 10, 2020, along with Spectrum Metals Limited (ASX: SPX) announced that they have inked a Bid Implementation Agreement, according to which RMS will offer to acquire all of the issued and outstanding ordinary shares in SPX that it does not already own under the terms of an off-market takeover offer. Under the offer, shareholders of SPX is expected to receive one RMS share for every ten SPX shares held with cash consideration of A$0.017 per SPX share held, valuing SPX shares at A$0.15 based on the Volume Weighted Average Price of RMS shares traded on February 7, 2020. The acquisition cost is expected to be funded from RMS’ existing working capital position or the recently established $35 million Syndicated Finance Agreement.
RMS Receives Final Environmental Approval for the Greenfinch Open Pit: On January 28, 2020, the company informed the market that final environmental approvals have been received for the Greenfinch open pit, adjacent to the Edna May operation in Western Australia. The Greenfinch open pit’s clearing permit was granted on 3 October 2019. Subsequently, the requirements for advertising period and offset proposal have now been satisfied. Moreover, the company also received final Federal environmental approval to proceed. More importantly, it now has clarity and confidence around the commencement of mining at Greenfinch, and location immediately adjacent to the Edna May processing plant is expected to deliver strong economic returns. In addition, this is expected to provide significant employment opportunities for the nearby Westonia community via mining personnel and service providers.
Top 10 Shareholders: The top 10 shareholders have been highlighted in the table which together form around 34.34% of the total shareholding. Ruffer LLP and Van Eck Associates Corporation hold maximum interest in the company at 7.65% and 5.53%, respectively..png)
Top 10 Shareholders (Source: Thomson Reuters)
A Quick Look at Key Metrics: EBITDA margin for FY19 stood at 32.0%, better than the industry median of 29.1%. Its current ratio for FY19 stood at 2.94x, better than the industry median of 1.75x, which implies that the company is in a better position to address its short-term obligations than its peer group..png)
Key Metrics (Source: Thomson Reuters)
Risk Analysis: The Company remains susceptible to various risks such as Fluctuations in the United States Dollar spot gold price and AUD/USD exchange rate; Government Regulations, new laws, rules and regulations on land use and water use, land claims, taxes, etc.; and Operating risks and hazards involved in the exploration, development and production of gold.
What to expect: As per the release, gold production for the March 2020 Quarter has been estimated in the range of 50,000– 55,000 ounces at an AISC of A$1,300 – 1,400/oz, where production at Mt Magnet (incl. Vivien) and Edna May (incl. Marda) have been estimated at 35,000 ounces at an AISC of A$1,275 – 1,375/oz and 17,500 ounces at an AISC of A$1,400 – 1,500/oz, respectively. Capital & project development expenditure for the March quarter has been estimated at A$18.7 million, where expenditures for Stellar open pit (Mt Magnet), Marda open pit pre-development work, Tampia (Edna May plant modifications) and Exploration (all projects) have been estimated at A$1.9 million, A$4.0 million, A$9.2 million and A$3.6 million, respectively.
FY20 production guidance has been estimated at 205 - 225,000 ounces at an AISC of A$1,225 - 1,325/oz with the quarterly breakdown by major ore source..png)
FY2020 Group Production Profile (Source: Company Reports)
Gold Outlook: At the time of writing, gold spot (XAU/USD) traded at ~US$1,585.4 (16:37 (UTC+11)). On the monthly timeframe chart, the gold price is trading above 20 EMA, 50 EMA and 200 EMA, indicating bull trend. Current macroeconomic concerns particularly the novel coronavirus (COVID-19), are expected to impact the global economy which has forced the global investor community to look for a safer asset class such as yellow metal. The bull trend in gold is expected to continue for some time, benefitting the gold producers and miners for short-to-medium term..png)
Monthly Candlestick chart of Gold Spot Price (XAU/USD) (Source: Thomson Reuters).png)
Key Valuation Metrics (Source: Thomson Reuters)
Valuation Methodology: PE Based Relative Valuation
.png)
PE Multiple Relative Valuation(Source: Thomson Reuters)
Note: All forecasted figures and peers have been taken from Thomson Reuters, NTM-Next Twelve Months
Technical Analysis:
Monthly Chart:.png)
(Source: Thomson Reuters)
Weekly Chart: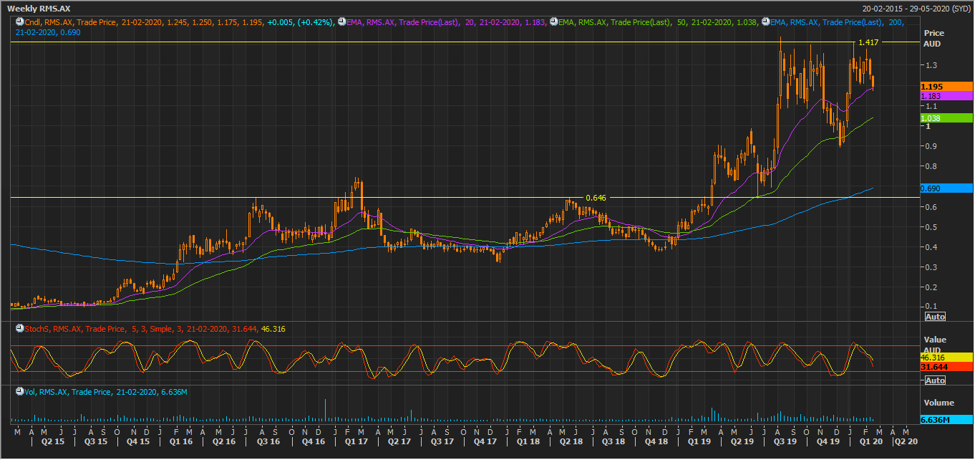
(Source: Thomson Reuters)
On both the charts, the stock is trading above 20 EMA, 50 EMA and 200 EMA, indicating bull trend. On the backdrop of decent fundamentals, the stock is expected to test the resistance level of $1.417 in the coming times.
Note: EMA – Exponential Moving Average
Stock Recommendation: RMS’ stock generated a negative YTD return of 7.03%, while in the span of one-year, RMS generated a good return of 91.94%. Considering the company’s business model, December’19 Quarter update, FY19 financial performance, profitability margins, shareholders’ pattern, FY20 guidance, and gold outlook, we have valued the stock using a relative valuation method, i.e., P/E multiple, and arrived at a lower double-digit growth (in % terms). Hence, we give a “Buy” recommendation on the stock at the current market price of $1.195, up 0.42% on February 18, 2020.
.jpg)
RMS Daily Technical Chart (Source: Thomson Reuters)
Disclaimer
The advice given by Kalkine Pty Ltd and provided on this website is general information only and it does not take into account your investment objectives, financial situation or needs. You should therefore consider whether the advice is appropriate to your investment objectives, financial situation and needs before acting upon it. You should seek advice from a financial adviser, stockbroker or other professional (including taxation and legal advice) as necessary before acting on any advice. Not all investments are appropriate for all people. Kalkine.com.au and associated pages are published by Kalkine Pty Ltd ABN 34 154 808 312 (Australian Financial Services License Number 425376). The information on this website has been prepared from a wide variety of sources, which Kalkine Pty Ltd, to the best of its knowledge and belief, considers accurate. You should make your own enquiries about any investments and we strongly suggest you seek advice before acting upon any recommendation. Kalkine Pty Ltd has made every effort to ensure the reliability of information contained in its newsletters and websites. All information represents our views at the date of publication and may change without notice. To the extent permitted by law, Kalkine Pty Ltd excludes all liability for any loss or damage arising from the use of this website and any information published (including any indirect or consequential loss, any data loss or data corruption). If the law prohibits this exclusion, Kalkine Pty Ltd hereby limits its liability, to the extent permitted by law to the resupply of services. There may be a product disclosure statement or other offer document for the securities and financial products we write about in Kalkine Reports. You should obtain a copy of the product disclosure statement or offer document before making any decision about whether to acquire the security or product. The link to our Terms & Conditions has been provided please go through them and also have a read of the Financial Services Guide. On the date of publishing this report (mentioned on the website), employees and/or associates of Kalkine Pty Ltd do not hold positions in any of the stocks covered on the website. These stocks can change any time and readers of the reports should not consider these stocks as personalised advice.
 Please wait processing your request...