Kalkine has a fully transformed New Avatar.
Company Overview: Sandfire Resources NL is a mining and exploration company. The Company's principal activities are production and sale of copper, gold and silver from its DeGrussa Mine in Western Australia, and exploration and evaluation of mineral tenements and projects in Australia and overseas. It has two segments: The DeGrussa Copper Mine and Exploration and evaluation. The DeGrussa Copper Mine is a copper-gold mine located in the Bryah Basin mineral province of Western Australia, approximately 900 kilometers north-east of Perth and 150 kilometers north of Meekatharra. The DeGrussa Copper Mine generates revenue from the sale of copper-gold products to customers in Asia. The Exploration and evaluation segment includes exploration and evaluation of the mineral tenements in Australia and overseas, including exploring for repeats of DeGrussa Volcanogenic Massive Sulfide (VMS) mineralized system at the Doolgunna Project and its investment in Tintina Resources Inc and WCB Resources Ltd.
.png)
SFR Details
Strengthening global copper development and exploration pipeline: Sandfire Resources NL (ASX: SFR) has an engagement in the production and sale of copper, gold and silver from the Group’s DeGrussa Copper-Gold Mine in Western Australia, development of Sandfire Resources America Inc.’s high-grade Black Butte Copper Project, and exploration, evaluation and development of mineral tenements and projects in Australia and overseas, including investment in early stage mineral exploration companies. On June 25, 2019, company published investors' presentation where it highlighted that Sandfire Resources will acquire MOD Resources Ltd that has T3 Project in Botswana as its flagship asset. The acquisition is expected to strengthen Sandfire’s global copper development and exploration pipeline, where T3 project's net present value has been estimated to be $309 Mn versus acquisition cost of $167 Mn. In the transactional process, MOD share would be priced at $0.45 per share, valuing the equity of MOD at $167 Mn. The MOD shareholders would be able to elect either from Scrip Consideration of 0.0664 Sandfire shares for every 1 MOD share held; or Cash Consideration of $0.45 per share, with the aggregate cash amount capped at $41.6 Mn. Post completion of the acquisition process, MOD shareholders would own between 10.4% and 13.3% of Sandfire shares, which is depending on the number of MOD shareholders electing Cash Consideration. Cash consideration and transaction costs to be funded from internal sources.
Valuation-wise SFR looks good with Net Margin at 41.8% in 1HFY19 as compared to the industry median of 12.5%. Return to the shareholders has also been decent with ROE coming in at 21.3%, which is higher than the industry median of 6.4%. The company’s decent gross margin, EBITDA margin and net margin indicate that the company is fundamentally stable and financially working well. Recent acquisitions, decent financial performances, and positive resource outlook are expected to help the company in delivering sustainable value to its customers and shareholders in the future.
.png)
Synergy expectation from combination of SFR & MOD (Source: Company Reports)
Top 10 Shareholders: The top 10 shareholders have been highlighted in the table which together form around 33.71% of the total shareholding. Vinva Investment Management Limited and LSV Asset Management are holding maximum interest in the company at 5.96% and 5.05%, respectively.
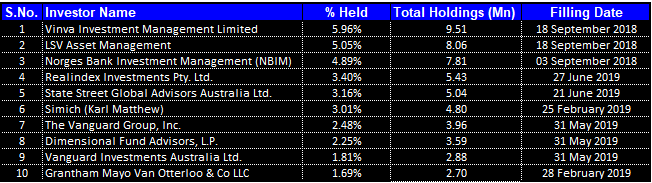
Top 10 Shareholders (Source: Thomson Reuters)
Commonwealth Bank Becomes Substantial Holder In SFR: The Company recently increased its interest in Adriatic Metals Plc from 7.65% voting power to 11.13% voting power, effective from June 28, 2019. In another update, Commonwealth Bank of Australia and its related bodies corporate became substantial holder to the Sandfire Resources NL with a voting power of 5.15%, effective from June 27, 2019.
Key Ratios: Its gross margin, EBITDA margin and net margin for H1FY19 stood at 90%, 72.5% and 41.8%, which are better than the industry median of 40.9%, 33.4%, and 12.5%, respectively, implying a decent financial performance by the company than its peer group. Its ROE for H1FY19 stood at 21.3%, which is better than the industry median of 6.4%, implying that the company generated a better return to its shareholders than its peer group.
Its current ratio for H1FY19 stood at 3.62x, which is better than the industry median of 1.88x, which implies the company is in a better position to address its short-term obligations. Its debt-to-equity ratio and long-term debt to Total capital indicate that the company during the half-year period has virtually remained debt free.
.png)
Key Ratios (Source: Thomson Reuters)
March’19 Quarter Key Highlights: The Total Recordable Injury Frequency Rate (TRIFR) for the Sandfire Group at the end of March was 7.1 as compared to 7.3 in the previous quarter. The company places emphasis over the prevention of incidents and principal hazard management, with the continued roll-out of new software to assist in managing and improving the safety culture and the management of risk for both the employees and contractors. The company recently signed Earn-in and Joint Venture agreement with White Rock Minerals Ltd (ASX: WRM) over the high- grade zinc VMS Red Mountain Project in Alaska, with Sandfire having the right to earn up to 70% project interest.

March’19 Production & Operations Data (Source: Company Reports)
~413,688 tonnes of ore grading 4.21% Cu was milled for the Quarter: Copper production for the Quarter was reported at 16,062 tonnes as compared to 16,888 tonnes in the previous quarter. C1 cash operating costs for the quarter was reported at US$0.92/lb as compared to US$0.85/lb in the previous quarter. Mine production for the Quarter was reported at 434,518 tonnes with production sourced from all lenses at DeGrussa (395,999t @ 4.26% Cu) and, for the first time, included stoping ore from the satellite Monty Copper-Gold Mine (38,519t @ 3.74% Cu). A total of 413,688 tonnes of ore grading 4.21% Cu was milled for the Quarter, with copper recovery averaging 92%.
Group’s cash on hand at the end of March’19 quarter was reported at $194.2 million (unaudited).

Production cost for DeGrussa Operations (Source: Company Reports)
C1 costs have risen in line with guidance which is impacted by Monty mining costs commencing with below LOM head grade in initial stopes, Reducing DeGrussa mining scale for total 1.6Mtpa target plant throughput inclusive of Monty, and Offset somewhat by continued strong gold production and price, impacting by-product credits.
H1FY19 (ended on December 31, 2019) Key Highlights: SFR delivered a strong operational and financial performance which was due to robust, consistent production and reduced unit operating costs at its flagship 100%-owned DeGrussa Copper-Gold Mine in Western Australia. It reported total revenue of $272.3 million from the value of metal payable sold of $303.5 million, whereas the total revenue in the previous corresponding period stood at $277.4 Mn. The headline revenue figure is presented after the adjustment of treatment and refining charges as well as price adjustment gains/losses. This result can be attributed to payable metal sales of 32,715 tonnes of contained copper and 20,721 ounces of contained gold, as compared to 30,222 tonnes of contained copper and 18,504oz of contained gold in the previous corresponding period.
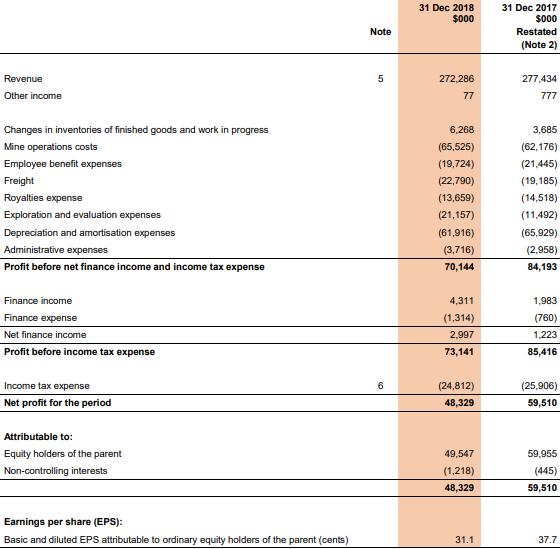
H1FY19 P&L Statement (Source: Company Reports)
Increase in exploration & evaluation expenses affected bottom-line: Profit before net finance and income tax was reported at $70.1 million as compared to $84.2 Mn in H1FY18, while pre-tax earnings were reported at $73.1 million as compared to $85.4 million.
The bottom-line result was achieved after the impact of non-DeGrussa segments, including increased exploration and evaluation expenditure (E&E). Higher E&E costs were driven by increased exploration activities at the Greater Doolgunna Project and evaluation costs associated with the Feasibility Study (FS) and Environmental Impact Statement (EIS) approvals process for Sandfire’s 86% owned Black Butte Copper Project in the USA, a key part of the Group’s global growth pipeline.
The DeGrussa operation delivered strong and consistent operational performance for the first-half, with the production of 34,813 tonnes of contained copper and 21,567 ounces of contained gold in the period, as compared to 31,512 tonnes of contained copper and 18,799 oz of contained gold in 1H FY 2018. As a result of the impressive production and cost performance, the DeGrussa Operations segment generated earnings before net finance and income tax of $101.7 million, which was marginally below the $105.4 million in the previous corresponding period despite the impact of lower copper prices. This was after depreciation and amortisation charges of $61.6 million which was also low as compared to $65.7 million in H1FY18. Cash flow from operating activities was reported at $97.5 million as compared to $106.3 million in H1FY18. The exploration and evaluation costs for the period was reported at $24.4 Mn as compared to $16.1 Mn in H1FY18.
What to expect: As per the report, production is ramping up from the company’s new ultra-high-grade Monty satellite mine. Moreover, an expected +20% rising grade profile from a blend of Monty and DeGrussa ore are expected to drive production higher over the next three years. At the same time, the company has a new high-quality offshore asset in the shape of the high-grade Black Butte Copper Project in Montana, which is in the final stages of getting permission grant (Record of Decision (ROD) and Mine Operating Permit).
Company’s decent, and growing, cash balance is expected to help it in maintaining its aggressive exploration commitments at both of its Doolgunna and East Coast portfolio over the coming 12 months.
FY19 Production Guidance: Targeted copper production for FY2019 has been further strengthened, with copper production expected to be in the guidance range of 66,000-68,000 tonnes of contained copper metal and gold production in the guidance range of 40,000-42,000 ounces of contained gold. Guidance for headline C1 cash operating costs has been lowered to ~US$0.90/lb.
Copper Application: Copper is the most recycled element among all the metals, and this feature helps in the massive amount of energy savings as it is a kind that doesn’t lose its physical and chemical properties on recycling as such. Given its wide use in so many applications such as piping, wiring, infrastructure, power generation, transportation, building construction, and electrical product manufacturing, etc., it is known to be an important contributor to any economy. Due to its aesthetic appeal, it is used in parts in construction work as it has a high melting point, and any treatment like burning etc., does not as such lead to the release of toxic gases.
Copper Outlook: Copper futures (CFD) have been trading close to its 52 weeks low levels, mainly due to trade war concerns which led to a decrease in global consumption and hence global growth. Moreover, continuous Copper supply led to the stockpile of Copper inventories, which led to a decrease in the Copper prices.
Various Copper miners and producers in such situation reduced the copper supply to balance the falling copper prices, which can be supported by the fact that 30 Day LME Copper Warehouse Stocks Level is reduced from around 252K tons in June 17, 2019 to ~239K tons in July 1, 2019.
As per the media reports, US and China at the G20 summit in Japan, have agreed to talk on resolving the trade dispute, which is a positive move for the global growth revival. It is further expected that the increase in infrastructure spending along with retail consumption especially in the Emerging markets such as India and South-East Asia, will help copper price to move an upside rally in the coming times.
Gold Outlook: Yellow metal looks bright when there is uncertainty in the market. Present ongoing trade-war concerns and recent eruption of US-Iran war concerns have worried the global investors. Many of them are hedging their investments by buying gold, therefore from short-to-medium term scenario, gold is expected to maintain its shining luster, which can be supported by the fact that Gold futures, (CFD) rose from US$1,322.70 on June 3, 2019 to ~US$1404.6 on July 2, 2019.

Key Valuation Metrics (Source: Thomson Reuters)
Valuation Methodology:
Method 1- Price/Earnings Multiple Approach (NTM):
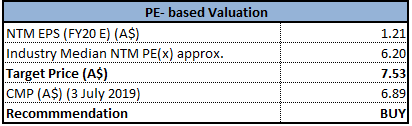
P/E Multiple Approach (Source: Thomson Reuters), *NTM-Next Twelve Months
Method 2- EV/Sales Multiple Approach (NTM):
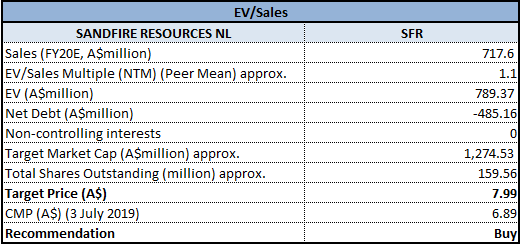
EV/Sales Multiple Approach (Source: Thomson Reuters)
Note: All forecasted figures and peers have been taken from Thomson Reuters, *NTM-Next Twelve Months
Stock Recommendation: Sandfire Resources’ shares generated a positive YTD return of 7.97%. It is presently trading below the average of 52 weeks high and 52 weeks low levels of $7.72, with decent PE multiple of 9.700x. The company’s key margins are better than the industry median (as mentioned above), which indicates decent financial performance by the company than its peer group. Its production guidance for contained copper and gold has strengthened along with the expectation of a reduction in C1 cash costs, which will help the company to enhance its earnings.
Moreover, the headwind due to low resources consumption is expected to stabilize over expectation of cooling-off of trade concerns between the US and China, which will help in the revival of global economic growth.
Therefore, with the decent volume growth visibility, healthy balance sheet, respectable operating margins and return ratios, we have valued the stock using two Relative valuation methods, P/E, and EV/Sales multiple and arrived at a double-digit upside growth (in %) in the next 12-18 months. Hence, in the view of aforesaid facts, we recommend a “Buy” rating on the stock at the current market price of $6.890 per share (down 0.289% on July 3, 2019).
).png)
SFR Daily Chart (Source: Thomson Reuters)
Disclaimer
The advice given by Kalkine Pty Ltd and provided on this website is general information only and it does not take into account your investment objectives, financial situation or needs. You should therefore consider whether the advice is appropriate to your investment objectives, financial situation and needs before acting upon it. You should seek advice from a financial adviser, stockbroker or other professional (including taxation and legal advice) as necessary before acting on any advice. Not all investments are appropriate for all people. Kalkine.com.au and associated pages are published by Kalkine Pty Ltd ABN 34 154 808 312 (Australian Financial Services License Number 425376). The information on this website has been prepared from a wide variety of sources, which Kalkine Pty Ltd, to the best of its knowledge and belief, considers accurate. You should make your own enquiries about any investments and we strongly suggest you seek advice before acting upon any recommendation. Kalkine Pty Ltd has made every effort to ensure the reliability of information contained in its newsletters and websites. All information represents our views at the date of publication and may change without notice. To the extent permitted by law, Kalkine Pty Ltd excludes all liability for any loss or damage arising from the use of this website and any information published (including any indirect or consequential loss, any data loss or data corruption). If the law prohibits this exclusion, Kalkine Pty Ltd hereby limits its liability, to the extent permitted by law to the resupply of services. There may be a product disclosure statement or other offer document for the securities and financial products we write about in Kalkine Reports. You should obtain a copy of the product disclosure statement or offer document before making any decision about whether to acquire the security or product. The link to our Terms & Conditions has been provided please go through them and also have a read of the Financial Services Guide. On the date of publishing this report (mentioned on the website), employees and/or associates of Kalkine Pty Ltd do not hold positions in any of the stocks covered on the website. These stocks can change any time and readers of the reports should not consider these stocks as personalised advice.
 Please wait processing your request...