Kalkine has a fully transformed New Avatar.

I. Sector Landscape and Outlook
The Utility sector consists of the essential services catering to the consumers’ need of water, wastewater management or sewage treatment, gas and power to mention a few. This essential service forms part of public facilities which are generally heavily regulated by the Government. The utility sector is a necessity for the upliftment of the society and economy as a whole. The 24/7 criticality of the industry makes it kind of safe investment for investors, holding stocks for long-term to infuse stable income into their portfolio.
Is Utility Sector A Stable and Reliable One? Is It So Even in Case of Economic Slowdown?
Well! The best connection can be the present pandemic effect of COVID-19 when all the businesses are closing amid the countrywide lockdown; utility sector remains operational to cater to the essential need of the consumers. Also, it is worth mentioning that the macro-environment has very less influence on the utility price, making it less volatile than the overall equity market.
The key queries which find an answer in this dossier are: How is retail competition driving the price? Do we have enough infrastructure to support electricity and gas retailing? Are Companies gaining in the near term? Or which Companies to Buy or Hold?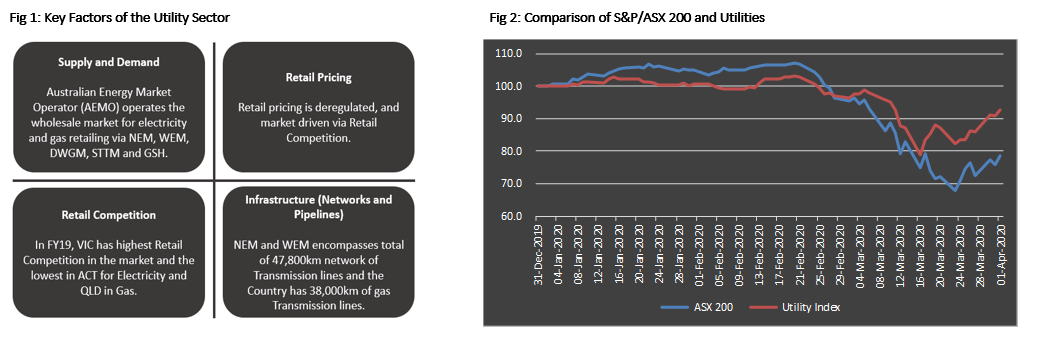
Supply and Demand: Retailing companies or Retailers buy energy from the wholesale market, i.e. national electricity market (NEM), encompassing the region such as Victoria (VIC), South Australia (SA), New South Wales (NSW), Australian Capital Territory (ACT), Queensland (QLD) and Tasmania (TAS) which covers around 80% of Australian electricity consumption. NEM is one of the largest interconnected grid or electricity system to which Western Australia (WA) and Northern Territory (NT) are not connected. These two states have their own electricity system with a distinct regulatory procedure.
That would be a massive network of pipelines and transmission lines covering the entire country! How is it operated for coherence?
Well! We have Australian Energy Market Operator (AEMO), an independent system and market operator for NEM, Wholesale Electricity Market (WEM) - operates only in the south-west interconnected system in WA, the entire network of WA, wholesale and retail gas market, supply hubs and gas systems.
Having said that we intend to keep our focus on NEM for understanding the market as it covers 80% of the market in Australia. NEM offers the platform or facilities in which the generators trade the electricity to the retailers on the spot market, which is a highly competitive courtesy to the huge number of participants (generators and retailers). After buying the energy from the wholesale market, retailers resell the purchased energy to the consumers where electricity transmitted over high voltage lines from generators is stepped down to lower voltage wires and poles by the electricity distributor.
Similar to Australian NEM, New Zealand has Transpower, owner of the transmission network in the Country, which maintains the system operation via private entities to offer expertise in the field of Pricing, Clearing and Reconciliation Manager.
The peak demand for electricity in Australia is anticipated to fall due to the advent of COVID-19 and shutting down of commercial and industrial businesses amid the lockdown. The demand is likely to shift towards domestic consumers like the weekend load profile. Interestingly during the period, the integration of renewable electricity generation will be easily used to cater the baseload since the demand can be easily forecasted amid the lockdown. Whereas, the gas consumption is likely to increase or remain the same though there is shutting down of restaurant, stores and offices. This is because social distancing puts pressure on the gas and even electricity consumption at home. Figure 3 and 4 below depict the trend of electricity and gas peak demand respectively. 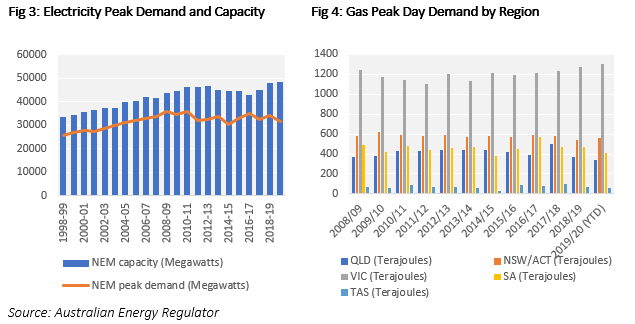
Moving onto the production side after assessing the demand side of energy retailing - The key answer related to the source of electricity generation and the trend of gas production in Australia lies in the ensuing section.
Around 60% of the total Australian electricity is generated by coal followed by natural gas, renewables and others. However, there exists variation in the fuel type vis-à-vis regions as the TAS and SA's majority of electricity generation is done by renewables, whereas NT stands for natural gas being a major source of electricity production. In case of gas generation, the maximum average daily production for the calendar year 2019 was Roma, QLD point (~3031 Terajoules per day) followed by Longford - Eastern Victoria (~547 Terajoules per day) and Moomba – SA/QLD (~193 Terajoules per day) to mention few.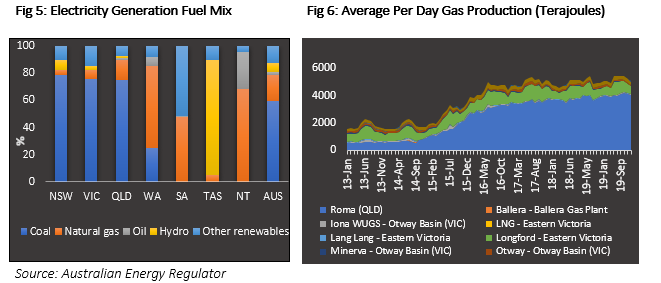
Let's now glance through the spot price of the wholesale market, which will be retailed to the consumers. The wholesale spot price is reduced in FY20 YTD as there is a high influx of renewable generation such as solar and wind lowering the wholesale electricity purchase costs. Whereas gas short term trading market (STTM) remains almost constant with a slight dip in September due to the oversupplied market as shown below.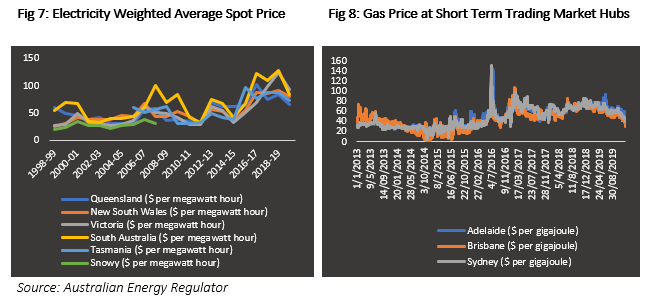
Retail Price: The price of electricity and gas retailing is important in case of essential services. The price of essentials is often seen to be subsidised for the lower income group of domestic consumers than the industrial and commercial users. Interestingly, it is notable to mention that the surge in income growth of the consumer is far lesser than the increment in electricity and gas price over time.
Not only in Australia but even in New Zealand, the retail electricity price surged by 50% between 2000 to 2018, according to the International Energy Agency (IEA) Report.
Fig 9: Australian Electricity and Gas Price vis-à-vis Income Growth Rate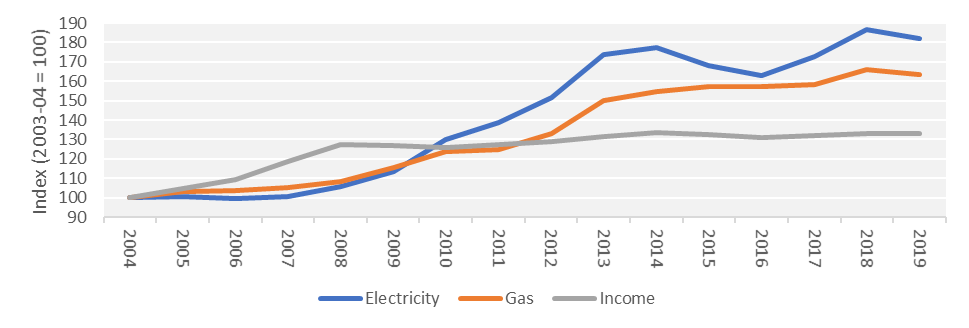
Source: Australian Energy Regulator (AER) and the Australian Bureau of Statistics
Having said that, the prosperity among the consumers and the company is matched often by the government initiatives. In Australia, "Hardship program", is an example supporting the customer via payment extension by the Government. Such initiatives sometimes need to be properly managed to minimise the rate of default by effectively offering different payment option of bills, best energy plans for the consumer and educate the consumers about different government schemes, energy rebates, tips of energy usage and financial counselling services by the utility.
In order to provide competitive price to the consumer, the concept of retail competition is applied in the country where the consumer can switch its supplier depending on the services of the retailing companies.
Retail Competition: The electricity and gas switching rate among the retailers determines the level of competition among the retailers in the region. Where VIC observed to be a region of higher competition and ACT to be lowest in Australia; however, in gas, the switching rate in the ACT is seen to be crossing QLD in FY 19. The switching rate in FY19 is higher than the previous year may be due to the higher standing offer price by the ActewAGL, leading to the switching of customers to another supplier with a better offer price.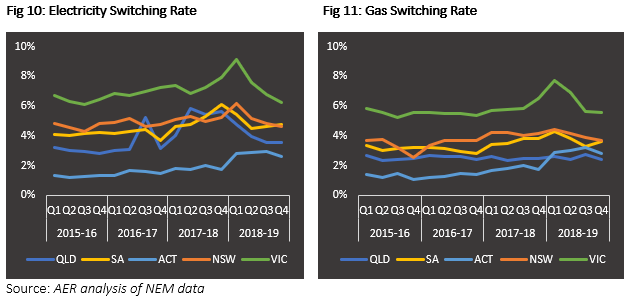
It is also worth mentioning that the standard offer contract price is not operating as intended to give the consumer the offer price of energy after the contract. However, the retailer is overstating the prices to promote unnatural high discounts to consumers. To overcome this problem, the Australian Competition and Consumer Commission (ACCC) intends to default charge the consumer at market price, assist in capping the residential and small business consumer charges. In the milieu of which the Australian Government came up with Default Market Offer (DMO) effective from 1 July 2019 in the region such as NSW, South Australia and south-east Queensland.
DMO will offer not only the common base for the consumer to compare various other retail supplier offerings but also helps retailers in devising their pricing strategy.
The total price component to a consumer depends on total energy consumption by the consumers, infrastructure charges, i.e. supply charges and other miscellaneous charges, as shown below:.png)
Source: AER analysis of NEM data
To add to the intensity of switching rate, New Zealand in 2018 had more than 50% of switching rate in the Country, which has ultimately helped in reducing the household power cost by ~0.7% during the year to March 2018.
Infrastructure (Networks and Pipelines): Australia’s electricity and gas infrastructure ranges from transmission and distribution network and pipelines. Transmission network transports electricity at high voltage (132kV or 275kV) from generators to the demand centres, whereas distribution network transports electricity from transmission network to the end consumer at low voltages (66kV or 415V).
Similarly, the gas transmission includes transmission pipelines and distribution pipelines. The produced gas is transmitted at high pressure, which also includes storage facilities to pump in the gas in the pipeline to meet the sudden peak demand or emergencies. The distribution pipelines transfer the gas received from transmission pipeline to the end-users via high and medium pressure pipeline to the city gate and demand centres, which in turn is transported to home or businesses using low-pressure pipelines.
Australia's two wholesale markets NEM and WEM encompasses around 40,000km and 7,800km network of transmission lines, respectively, spanning across eastern and south-eastern Australia and Western Australia respectively. NEM supplies around 200TWh and WEM ~18TWh of electricity per year to the end consumers, i.e. businesses and households. AEMO also operates Victorian Declared Wholesale Gas Market (DWGM), the Wallumbilla Gas Supply Hub (GSH) and the Gas Short Term Trading Market (STTM). The country has a total of 38,000km of gas transmission lines which transmit almost all the Australian natural gas.
Also, it is pertinent to mention that in New Zealand, Transpower – the national grid has 12,000km network of transmission lines which are used for the power supply across the country.
The traded value and volumes at the Australian wholesale markets are: -.png)
Source: Australian Energy Market Operator
II. Investment Theme and Stocks under Discussion (IFT, AGL, CEN, APA)
After gauging through the electricity and gas retailing know-how, let’s take a detailed view of the companies operating in this sector, i.e. both infrastructure providers and energy supplier, in terms of their performance and outlook. To assess the same, companies’ stocks are evaluated based on Discounted Cash Flow (DCF), as analysed below.
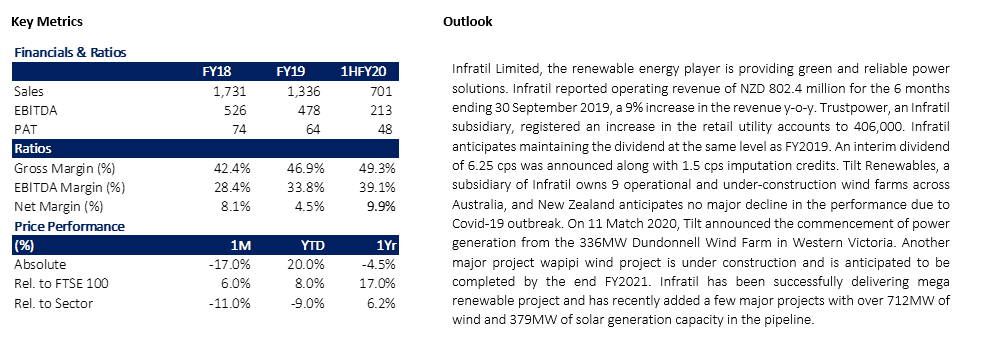
1. ASX: IFT (INFRATIL LIMITED)
(Recommendation: Buy, Potential Upside: 17%)
Infratil is a renewable energy player involved in wind and solar power generation and distribution. It has a market cap of A$ 2.56 billion and a dividend yield of ~5% as on 1 April 2020 closing price.

Valuation
Our valuation model suggests that stock has a potential upside of ~17% on 1 April 2020 closing price.
2. ASX: AGL (AGL ENERGY LIMITED)
(Recommendation: Buy, Potential Upside: 16%)
AGL Energy is one of the largest power player involved in generation and distribution business. It has a market cap of A$ 11.1 billion and a dividend yield of ~8.5% on 1 April 2020 closing price.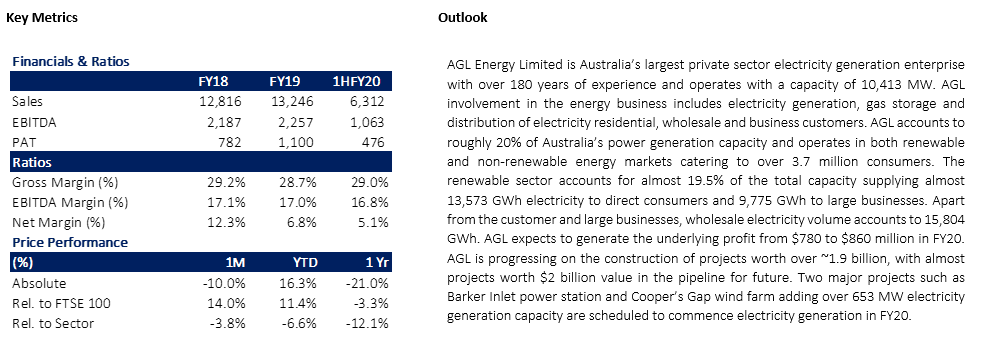
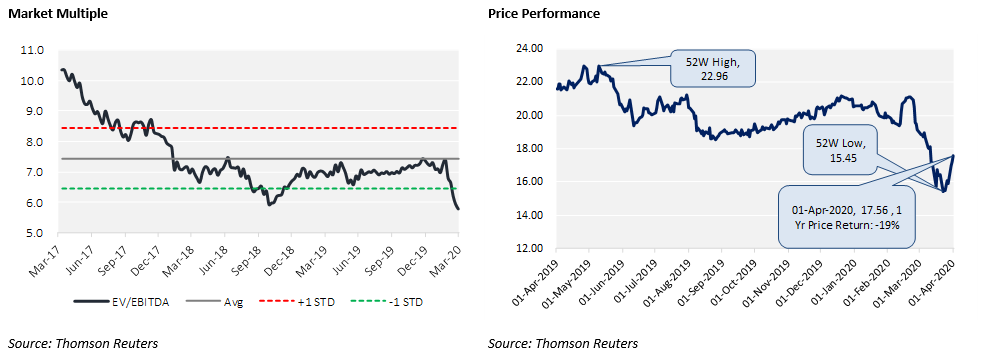
Valuation
Our valuation model suggests that stock has a potential upside of ~16% on 1 April 2020 closing price.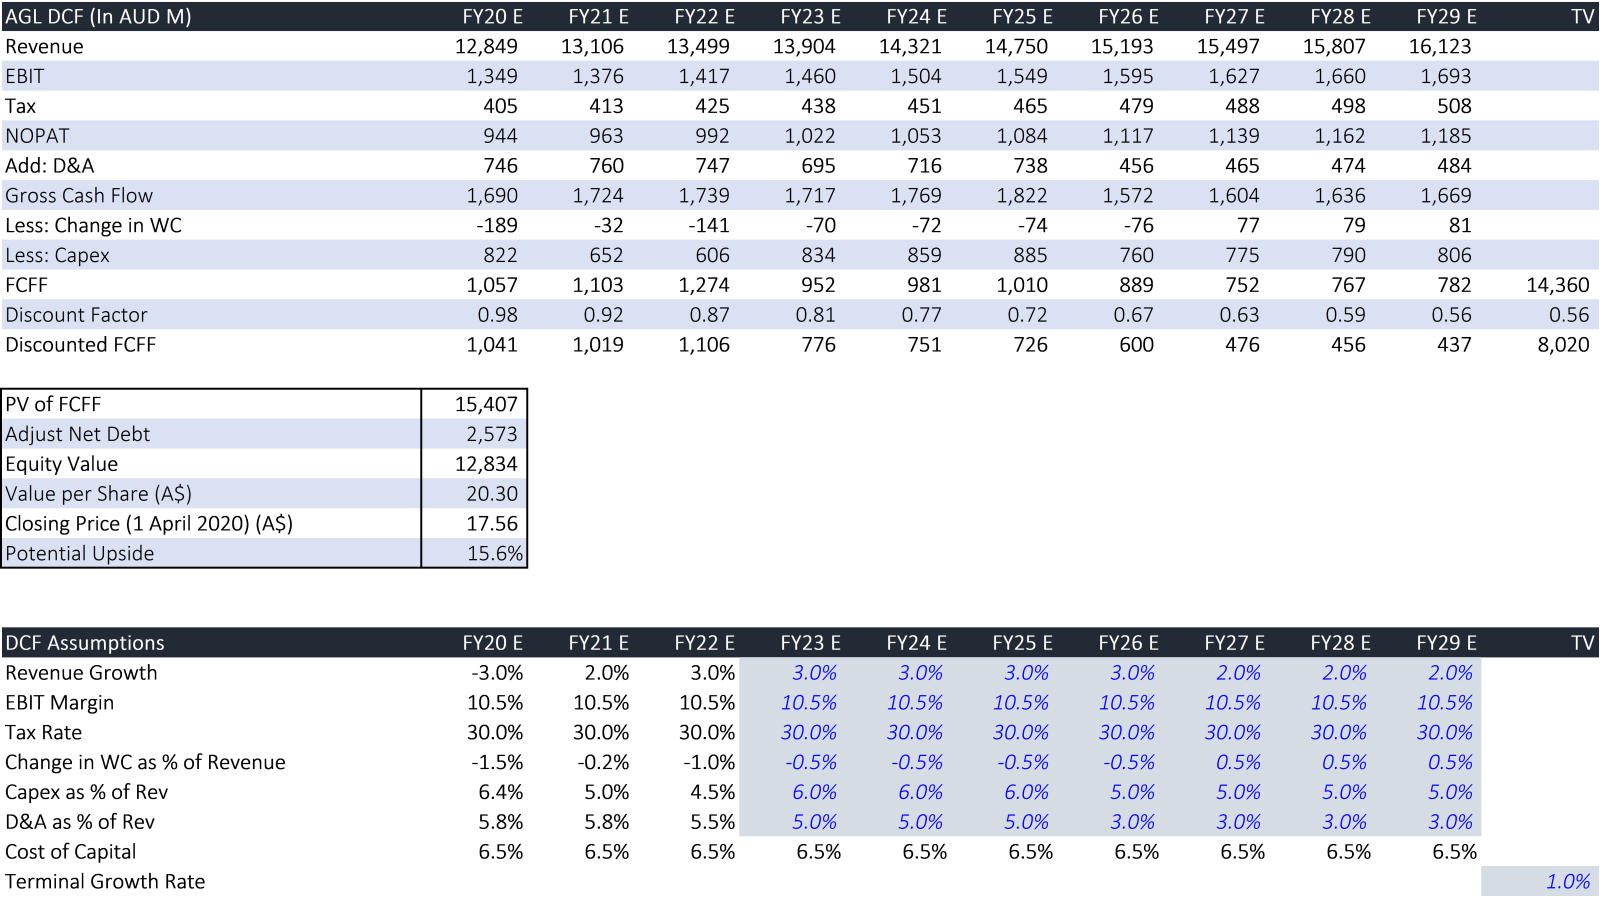
3. ASX: CEN (CONTACT ENERGY LIMITED)
(Recommendation: Buy, Potential Upside: 16%)
Contact Energy is one of the largest NZ player in renewable energy and thermal power. The company market cap stood at A$ 4.1 billion and has a dividend yield of ~8.3% as on 1 April 2020 closing price.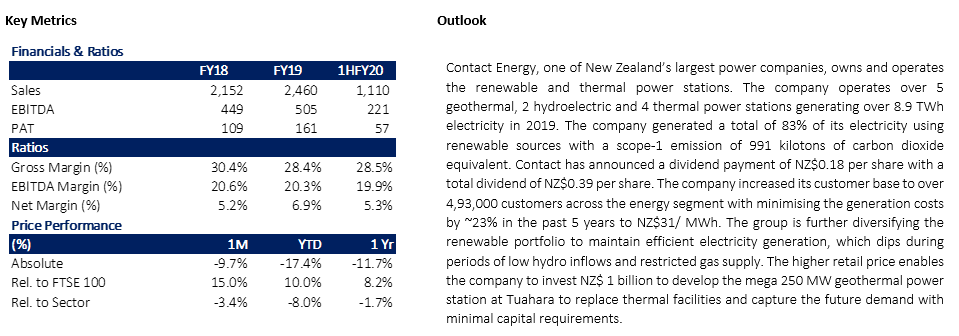
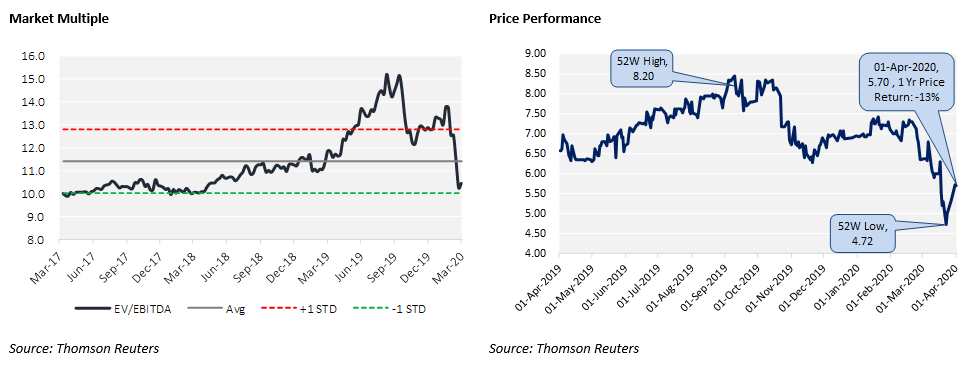
Valuation
Our valuation model suggests that stock has a potential upside of ~16% on 1 April 2020 closing price.
4. ASX: APA (APA Group)
(Recommendation: Hold, Potential Upside: 7%)
APA group is a gas and renewable power player involved in power generation, gas and power transmission and distribution activities. It has a market cap of A$ 12.4 billion and dividend yield of ~5.3% as on 1 April 2020 closing price.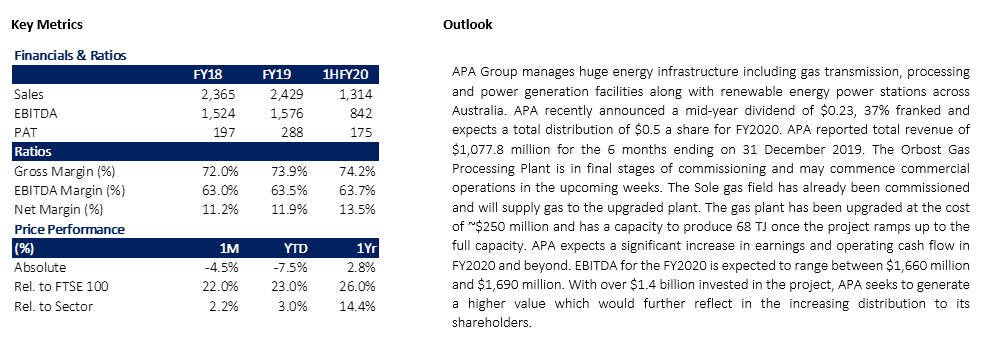
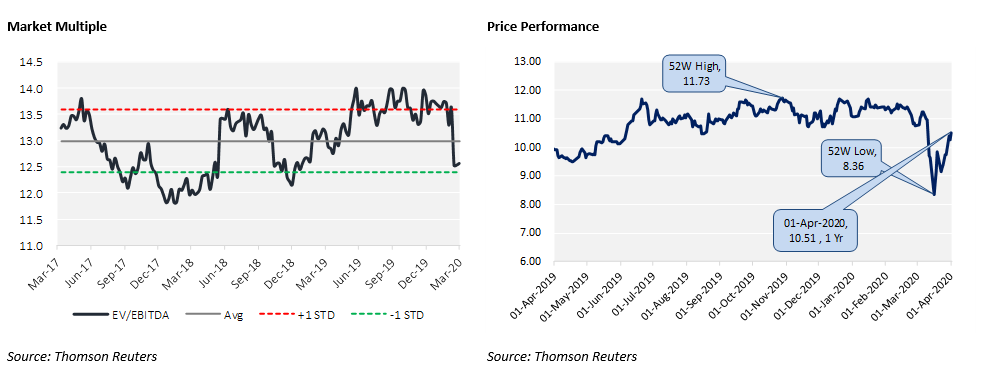
Valuation
Our valuation model suggests that stock has a potential upside of ~7% on 1 April 2020 closing price.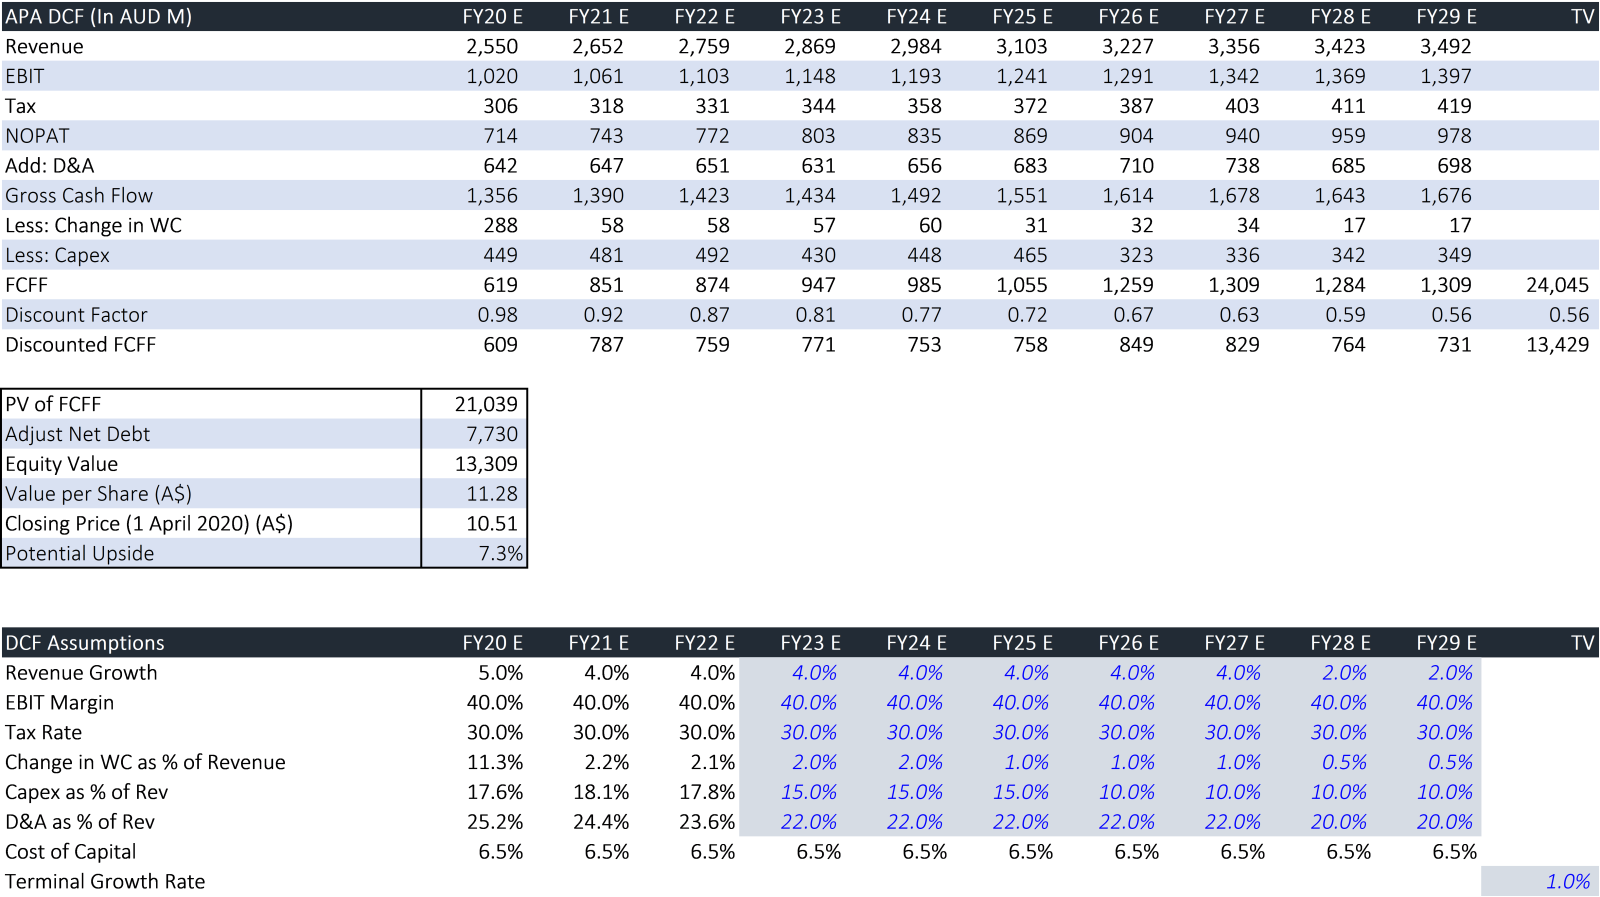
Note: All the recommendations and the calculations are based on the closing price of 1 April 2020. The financial information has been retrieved from the respective company’s website and Thomson Reuters
Disclaimer
The advice given by Kalkine Pty Ltd and provided on this website is general information only and it does not take into account your investment objectives, financial situation or needs. You should therefore consider whether the advice is appropriate to your investment objectives, financial situation and needs before acting upon it. You should seek advice from a financial adviser, stockbroker or other professional (including taxation and legal advice) as necessary before acting on any advice. Not all investments are appropriate for all people. Kalkine.com.au and associated pages are published by Kalkine Pty Ltd ABN 34 154 808 312 (Australian Financial Services License Number 425376). The information on this website has been prepared from a wide variety of sources, which Kalkine Pty Ltd, to the best of its knowledge and belief, considers accurate. You should make your own enquiries about any investments and we strongly suggest you seek advice before acting upon any recommendation. Kalkine Pty Ltd has made every effort to ensure the reliability of information contained in its newsletters and websites. All information represents our views at the date of publication and may change without notice. To the extent permitted by law, Kalkine Pty Ltd excludes all liability for any loss or damage arising from the use of this website and any information published (including any indirect or consequential loss, any data loss or data corruption). If the law prohibits this exclusion, Kalkine Pty Ltd hereby limits its liability, to the extent permitted by law to the resupply of services. There may be a product disclosure statement or other offer document for the securities and financial products we write about in Kalkine Reports. You should obtain a copy of the product disclosure statement or offer document before making any decision about whether to acquire the security or product. The link to our Terms & Conditions has been provided please go through them and also have a read of the Financial Services Guide. On the date of publishing this report (mentioned on the website), employees and/or associates of Kalkine Pty Ltd do not hold positions in any of the stocks covered on the website. These stocks can change any time and readers of the reports should not consider these stocks as personalised advice.
 Please wait processing your request...