Kalkine has a fully transformed New Avatar.

Company Overview: Viva Energy Group Ltd is an Australia-based integrated downstream petroleum company. The Company operates across three business segments: Retail, Fuels and Marketing; Refining; and Supply, Corporate and Overheads. Retail, Fuels and Marketing segment consists of retail and commercial operations. Retail, which supplies and markets fuel products and lubricants through a national network sites. Commercial, which supplies of fuel, lubricants and specialty products to commercial customers. Refining segment owns and operates the Geelong Refinery, in Victoria, which converts imported and locally sourced crude oil into petroleum products including gasoline, diesel, jet fuel, aviation gasoline, gas, solvents, bitumen and other specialty products. Supply, Corporate and Overheads segment owns contracted access to a national infrastructure network comprising terminals, retail sites, storage tanks, depots and pipelines positioned across metropolitan and regional Australia.
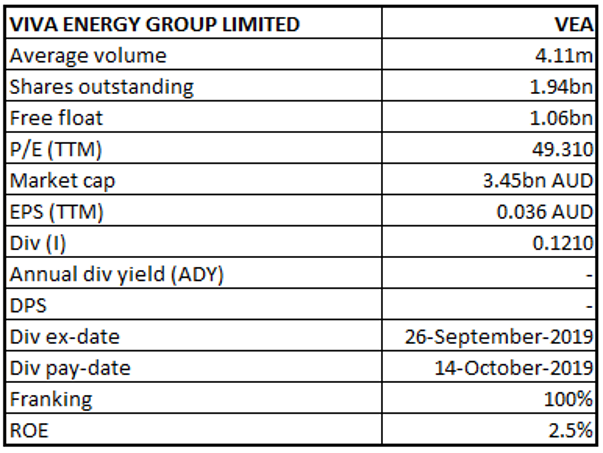
VEA Details
Decent Top-line and Bottom-line Performance for FY14-18: Viva Energy Group Limited (ASX: VEA) is involved in sales of fuel and specialty products through Retail and Commercial channels across Australia; management of national supply, distribution and terminal network; and manufacturing activities at the group’s Geelong oil refinery. It supplies high quality Shell fuels and lubricants in Australia through an extensive network of service stations. Looking at the past performance over FY14 to FY18, total revenue and net income of the company have grown with a CAGR (compounded annual growth rate) of 27.29%and 37.56%, respectively. Group’s total revenue improved from $6,245 Mn in FY14 to $16,395 Mn in FY18, and net income improved from $162 Mn in FY14 to $580 Mn in FY18.
As per the company outlook, the total sales volumes in the second half of FY19 are expected to remain in line with sales volumes achieved in the first half of FY19. VEA remains determined to achieve its medium-term target of lifting sales volumes through the Alliance channel to 70 million litres per week and then 75 million litres per week, with competitive retail fuel prices. As a result of improved price positioning and focus on progressing a range of marketing initiatives such as the Coles Little Shop 2 promotion (available at Coles Express), volume performance has been encouraging in the month of July and August 2019. Due to heightened competition, oil price volatility, and a lower Australian dollar putting pressure on retail fuel prices, retail fuel margins remain lower than average during the early part of the second half of FY19. Retail earnings are unlikely to improve from the Underlying EBITDA (RC) result achieved in the first half of FY19. The company is also committed in improving margin performance through cost and supply chain efficiencies in the commercial market despite extreme competition.
The company aims to focus on (1) continued operational excellence along with reliable and safe operations; (2) expand its market via innovation and a dedicated customer-centric focus; and (3) deliver attractive and sustainable returns to its shareholders and consistent operating cash flows.
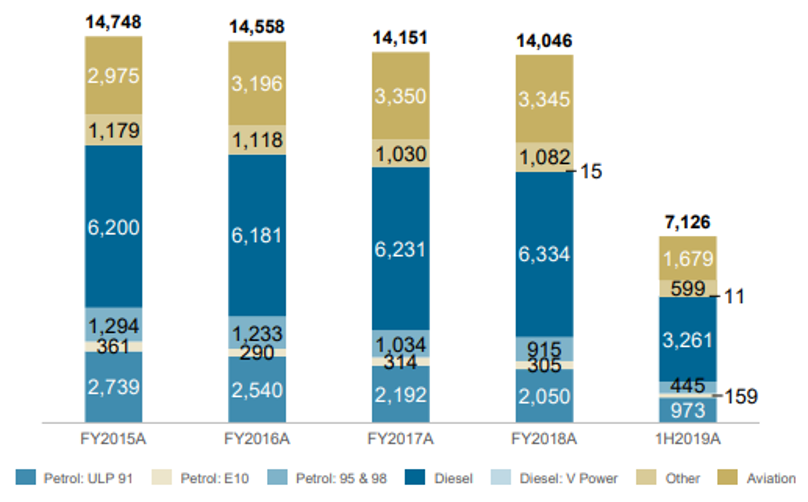
Data on Total Volumes Sold by Product (Source: Company Reports)
September’19 Quarter Key Highlights: The actual Geelong Refining Margin (GRM) for the third quarter of FY19 was reported at US$8.8/Barrel (BBL), with refining intake of 9.7MBBLs (Million Barrels (MBBL). The GRM for this quarter includes the effect of planned maintenance of the Platformer in August 2019 and higher crude premiums. Improved regional refining margins supported the refining margin, and the gasoline margins were improved over levels achieved during H1FY19.
Under the retail segment, the average sales volumes for the Alliance channel were reported at 64.9 million litres per week through Q3FY19, which is an increase of 1.4% on the same period last year and 9.1% on the average weekly sales volumes during H1FY19. The increase in Alliance volumes can be attributed to the improved retail fuel pricing, loyalty program redemptions, and joint marketing campaigns with Coles. Due to intensified competition and economic conditions, retail margins in H2FY19 were expected to remain lower than average, despite improvements in sales volumes.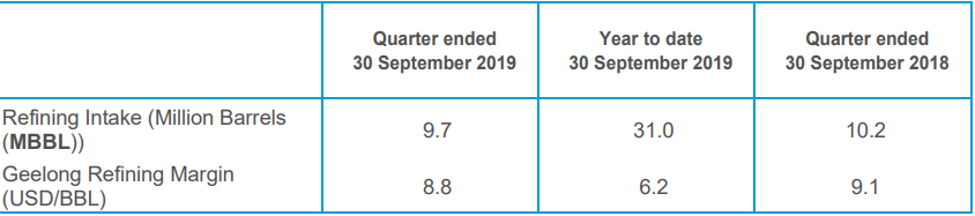
Refining segment Data for Q3FY19 (Source: Company Reports)
H1FY19 Key Highlights for the period ended June 30, 2019: During the period, the company successfully renegotiated the Alliance partnership with Coles Express and the acquisition of the Liberty Wholesale business. Total sales volume for the period increased by 2.5% to 7,126 million litres, as compared to the previous corresponding period. The company reported Refining operational availability of 94% along with refining intake of 21.4 mbbls, an increase of 12% on previous corresponding period. The diesel production was reported at a record level of 40% of total production, an increase of 36% on FY18.
Group Underlying EBITDA (RC) for the half year period remained at the upper end of the guidance range of $150 – 180 million, at $171.6 million. Similarly, the Underlying Net Profit After Tax (NPAT)(RC) was reported at the upper end of the guidance range of $60 – 80 million, at $78.0 million. Net debt at the end of the period was reported at $168.7 million, as compared to net cash of $0.2 million as on December 31, 2018, which includes the one-off payment of $137.0 million made to Coles Express for the Alliance transaction. The Board of Directors declared a fully franked interim dividend of 2.1 cents per share, reflecting a payout ratio of 60% of Distributable NPAT (RC).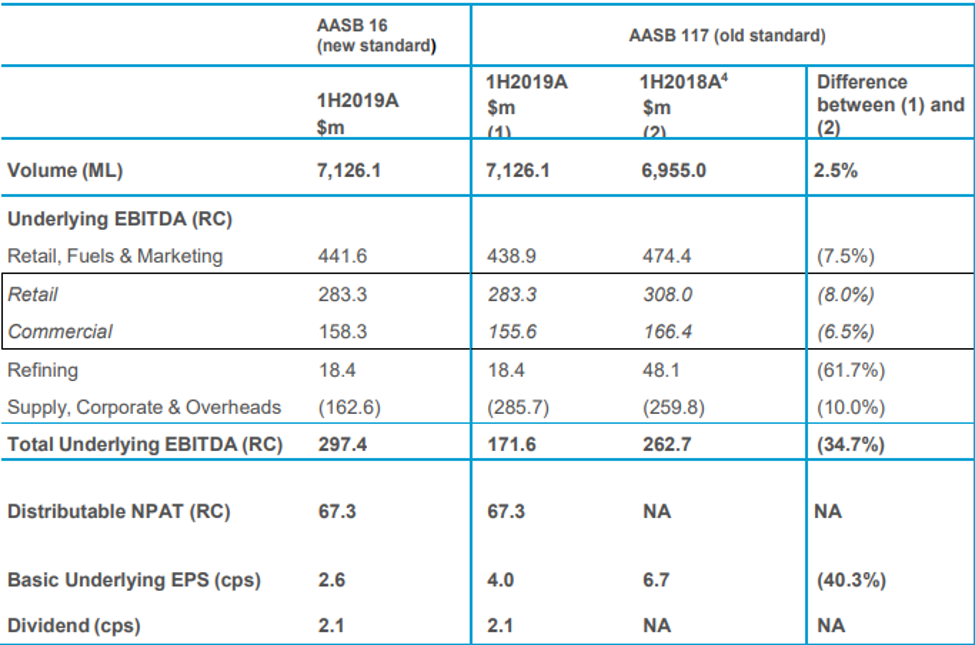
H1FY19 Key Financial Metrics (Source: Company Reports)
Recent Updates:
Recently, the company informed the market that it has agreed with Shell Brands International AG for the extension of the license of the Shell brand on retail automotive fuels in Australia until December 31, 2029, which will be on the same commercial terms as the existing agreement. The company has a long history as the guardian of the Shell brand on retail automotive fuels in Australia, and with the license extension agreement, it will be continuing this partnership for a long period of time.
Top 10 Shareholders: The top 10 shareholders have been highlighted in the table, which together form around 69.68% of the total shareholding. Viva Energy B.V. and Nikko Asset Management Australia Limited hold maximum interests in the company at 44.84% and 5.11%, respectively.
Recently, the company’s director Scott Wyatt disposed-off 2,883,928 Options at a total exercise price of $2,364,820.96 to acquire 2,883,928 ordinary shares, taking the final holdings to 10,958,920 ordinary shares and performance rights of 480,000 (2018 LTIP) and 541,198 (2019 LTIP), effective from January 2, 2020.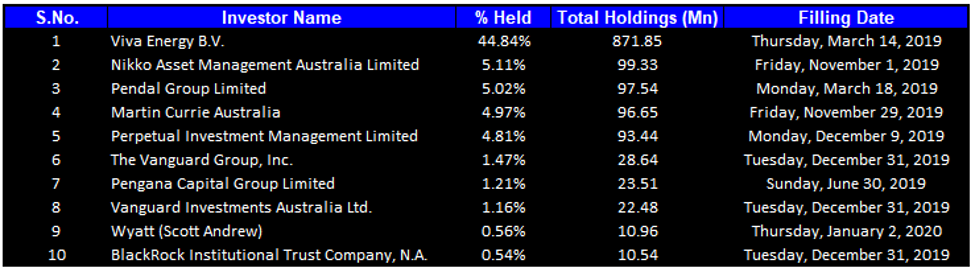
Top 10 Shareholders (Source: Thomson Reuters)
A Quick Look at Key Metrics: Its gross margin and EBITDA margin for H1FY19 stood at 9.0% and 3.8%, better than the H1FY18 results of 8.1% and 2.9%, respectively, implying improving fundamentals of the company.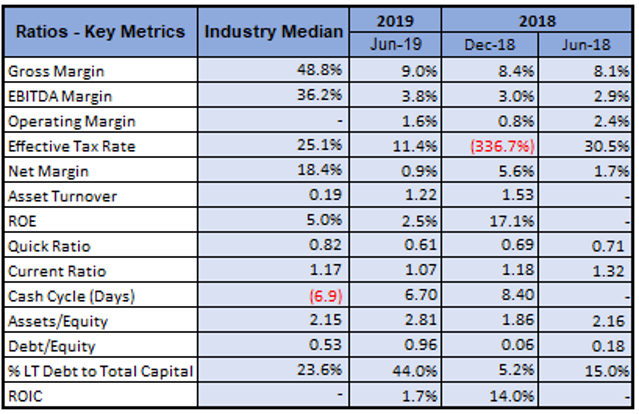
Key Metrics (Source: Thomson Reuters)
Key Risks: The company is susceptible to certain risks such as operational and supply chain risks, compliance and regulatory risk, commodity price exposure, health, safety, security & environmental risks, climate change, liquidity and financing risk, refinery margin exposure risk, exchange rate risk, credit risk and risk associated with labor costs and industrial disputes.
What to expect: As per the release, the company expects its sales volumes for FY2019 to be in the range of 14,600 to 14,700 million litres, an increase of ~4.3% on FY18 sales volumes. Weekly sales in the retail Alliance channel have been estimated to be around 65 million litres per week for the second half of FY19, an increase of 9.2% on previous half year. Due to oil price volatility and periods of heightened competition in the market, retail fuel margins in FY2019 were anticipated lower than FY2018. The company anticipated strong sales data in commercial segment for FY19 despite softer economic conditions and lower market growth. Commercial earnings were anticipated to get impacted by the continued competition, elevated shipping costs and lower exchange rates. As a result of optimizing crude selection and the production slate, operational performance at Geelong Refinery was strong during the year.
Due to increased property and supply chain management costs, coupled with some non-recurring benefits achieved in FY2018, the supply, corporate & overheads are expected to increase relative to FY2018. Group Underlying EBITDA (RC) for FY2019 is expected to be in the range of ~$625 - $655 million. Underlying NPAT (RC) for FY2019 is anticipated to be in the range of ~$135 - $165 million.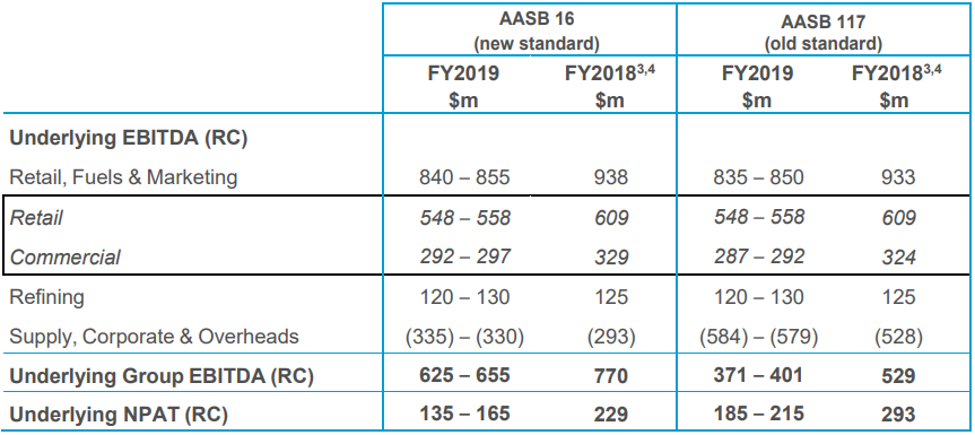
FY2019 Unaudited Financial Guidance (Source: Company Reports)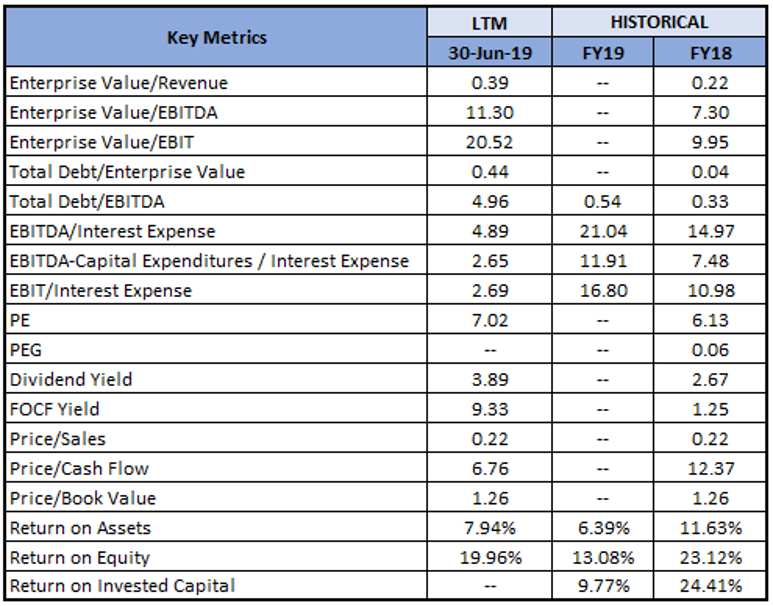
Key Valuation Metrics (Source: Thomson Reuters)
Valuation Methodology: Price to Earnings (PE) Multiple Approach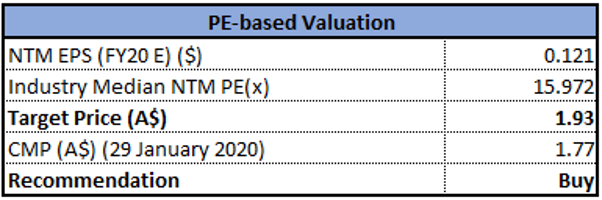
Price to Earnings (PE) Multiple Approach (Source: Thomson Reuters)
Note: All forecasted figures and peers have been taken from Thomson Reuters, NTM-Next Twelve Months
Technical Analysis:
Weekly Chart: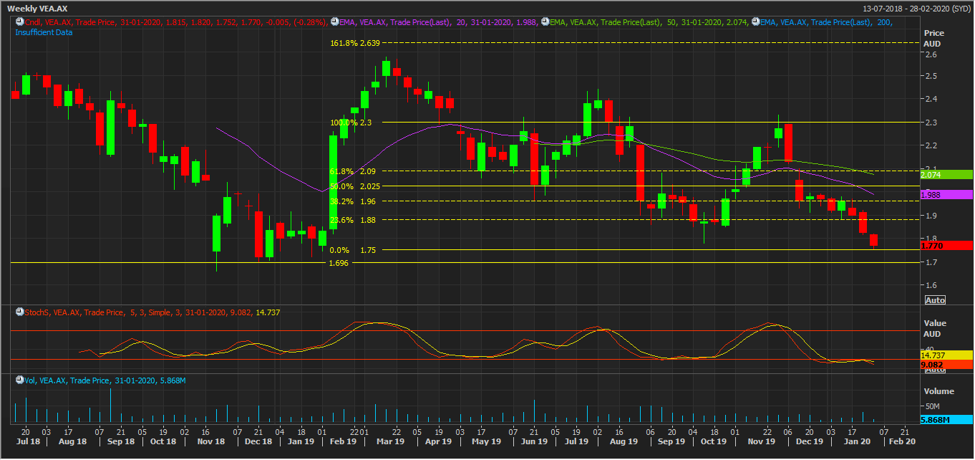
(Source: Thomson Reuters)
The stock is trading close to its 52 weeks low level of $1.745, which increases the probability for a bounce back, underpinned by a strong support zone of $1.75- $1.696 and oversold region in stochastic indicator. The stock on rebound may test Fibonacci projection level of 23.6% ($1.88), and break-on which the next level of 38.2% ($1.96).
Note: EMA – Exponential Moving Average
Stock Recommendation: VEA’s stock posted a negative six months return of 25.42%, while in the span of one year it posted a return of 0.85%. Currently, the stock is trading close to its 52-weeks low level of $1.745, proffering an opportunity for accumulation. Considering the company’s business model, recent updates, Q3FY19 results, H1FY19 performance, outlook provided, FY19 guidance and current trading level, we have valued the stock using a relative valuation method i.e., Price to Earnings (PE) multiple, and arrived at a high single-digit growth (in % terms). Hence, we give a “Buy” recommendation on the stock at the current market price of $1.770, down 0.282% on January 29, 2020..png)
VEA Daily Technical Chart (Source: Thomson Reuters)
Disclaimer
The advice given by Kalkine Pty Ltd and provided on this website is general information only and it does not take into account your investment objectives, financial situation or needs. You should therefore consider whether the advice is appropriate to your investment objectives, financial situation and needs before acting upon it. You should seek advice from a financial adviser, stockbroker or other professional (including taxation and legal advice) as necessary before acting on any advice. Not all investments are appropriate for all people. Kalkine.com.au and associated pages are published by Kalkine Pty Ltd ABN 34 154 808 312 (Australian Financial Services License Number 425376). The information on this website has been prepared from a wide variety of sources, which Kalkine Pty Ltd, to the best of its knowledge and belief, considers accurate. You should make your own enquiries about any investments and we strongly suggest you seek advice before acting upon any recommendation. Kalkine Pty Ltd has made every effort to ensure the reliability of information contained in its newsletters and websites. All information represents our views at the date of publication and may change without notice. To the extent permitted by law, Kalkine Pty Ltd excludes all liability for any loss or damage arising from the use of this website and any information published (including any indirect or consequential loss, any data loss or data corruption). If the law prohibits this exclusion, Kalkine Pty Ltd hereby limits its liability, to the extent permitted by law to the resupply of services. There may be a product disclosure statement or other offer document for the securities and financial products we write about in Kalkine Reports. You should obtain a copy of the product disclosure statement or offer document before making any decision about whether to acquire the security or product. The link to our Terms & Conditions has been provided please go through them and also have a read of the Financial Services Guide. On the date of publishing this report (mentioned on the website), employees and/or associates of Kalkine Pty Ltd do not hold positions in any of the stocks covered on the website. These stocks can change any time and readers of the reports should not consider these stocks as personalised advice.
 Please wait processing your request...