Kalkine has a fully transformed New Avatar.

Company Overview: Westgold Resources Limited (ASX: WGX) is a dominant gold producer in the Central Murchison region of Western Australia. Its projects comprise Rover Project, Tuckabianna Project, Fortnum Gold Project (FGP), South Kalgoorlie Operations (SKO) and Central Murchison Gold Project (CMGP). Moreover, it has an interest of 10.32% in RNC Minerals (listed on the Toronto Stock Exchange (TSX: RNX)), which was acquired as a result of the sale of Higginsville. It has an interest of 16.01% in Musgrave Minerals Limited (ASX: MGV), which is involved in the exploration of base metals and gold in Australia. Moreover, it has an interest of 0.73% and 0.85% in Auris Minerals Limited (Auris) and Aruma Resources Limited (Aruma), respectively. Auris is involved in the exploration of base metals in Australia and Aruma is involved in the exploration of gold in Australia. Both Auris and Aruma are listed on the Australian Securities Exchange..png)
WGX Details
Top-line Grew at a CAGR of 21.03% over FY14-19: Westgold Resources Limited (ASX: WGX) is involved in the exploration, development and operation of gold mines, primarily in Western Australia. It has a good percentage stake in RNC Minerals and Musgrave Minerals Limited, and little interest in Auris Minerals Limited (Auris) and Aruma Resources Limited (Aruma). At the end of the first half FY20, the fair value of the Group’s investments in Auris and Aruma were reported at $42,000 and $18,000, respectively, based on their quoted share price.
Looking at the past performance over FY14 to FY19, total revenue of the company has grown with a CAGR (compounded annual growth rate) of 21.03%. Group’s total revenue improved from $161.1 million in FY14 to $418.3 million in FY19. The group showed a substantial improvement in financial outcomes for the first-half of FY20, where the mining segment of Fortnum Gold Operations (FGO) and Meekatharra Gold Operations (MGO) were strongly profitable while the performance at Cue Gold Operations (CGO) reflected the development phase prior to the transition to steady-state operations. Large amount of capital investment was absorbed at CGO to re-establish Big Bell, the Group’s largest mine, to support long-term production. Moreover, a considerable amount of working capital was consumed to commence the operation of a third underground mine at MGO (Bluebird Mine) and the pre-stripping of open pits in the Meekatharra North area.
Gold output for FY20 is expected to improve in comparison to FY19, with reduction expectation in cash cost and All-In Sustaining Cost (AISC) for FY20.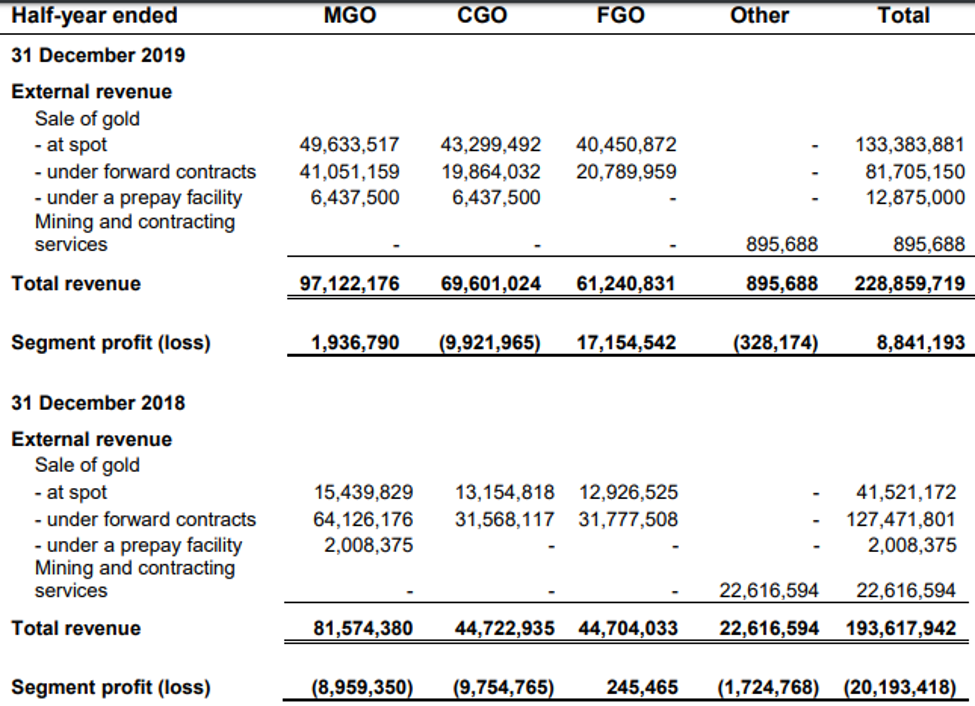
Operating Segment Revenue Comparison (Source: Company Reports)
H1FY20 Key Highlights for the period ended December 31, 2019: Revenue from ordinary activities for the period was reported at $228.86 million, an increase of 18% on the previous corresponding period (pcp). Cost of sales (inclusive of depreciation and amortisation expenses of $62.21 million) for the period was reported at $219.56 million, an increase of 4% on pcp. Profit from ordinary activities after tax attributable to members for the period was reported at $9.74 million as compared to a loss of $11.23 million in the previous corresponding period. Moreover, the company reported a net loss attributable to members in the prior period at $17.78 million.
The financial result reflected an accounting gain of $9.75 million, supported by a rise in the consolidated revenue of $35.24 million in comparison to the prior period due to an increase in production of 17,114 ounces as well as an increase in the average gold sales price.
Gold production for the period was reported at 120,127 oz, as compared to 103,013 oz in the previous corresponding period (pcp). Cash costs per ounce for the period was reported at $1,236, an increase of 8% on pcp. All-in sustaining costs per ounce for the period was reported at $1,480, as compared to $1,485 in the previous corresponding period.
Under cash flow statement, cash inflow from operating activities (inclusive of a reduction in trade payables of $5.58 million) for the period was reported at $54.39 million, an increase of 2279% on pcp. Cash outflow from investing activities (inclusive of an investment in property plant and equipment of $15.34 million, mainly associated with the surface contract mining services department) for the period was reported at $80.61 million, an increase of 25% on pcp.
Cash outflow from financing activities (inclusive of proceeds from shares issued on the exercise of options) for the period was reported at $7.00 million, an increase of 78% on pcp. Shares issued on the exercise of options resulted in the generation of net cash inflow of $20.84 million, replenishing the working capital. Cash and cash equivalents at the end of the period were reported at $47.98 million, an increase of 29% on pcp.
Under the balance sheet, total assets at the end of the period were reported at $682.84 million, an increase of 1% on pcp. Total liabilities at the end of period were reported at $230.10 million, an increase of 1% on pcp. Net Assets at the end of the period were reported at $452.73 million, an increase of 2% on pcp. Net tangible asset per share for the period was reported at $1.10 as compared to $1.06 in the previous corresponding period..png)
H1FY20 Income Statement (Source: Company Reports)
Recent Updates:
(a) On February 26, 2020, the company informed the market that it has accepted the resignation of Mr. Suresh Shet, a Non-Executive Director and nominee of Golden and Energy Resources Ltd (GEAR) of Singapore. His resignation came in during the appointment of Mr. Wayne Bramwell as an Independent Non-Executive Director as per the planned Board re-shuffle program. These changes enable the Board to align the developmental structure with the company’s size, expanded operations and growth plans.
(b) On February 18, 2020, the company provided a gold hedging update to the market, where it highlighted that it used the recent strength in the Australian gold price to restructure and extend its hedge book with its banking counterparty, Citibank, adding a further 60K oz at spot prices above A$2350/oz. The new hedge structurer results in the increase of received price for all hedge ounce, and, hence increasing revenue. Additionally, the company reduced its gold pre-pay outstanding balance to 6,250 oz. By delivering 1,250 oz per month, WGX continues to repay the loan with the expectation of it being eliminated by the end of the financial year.
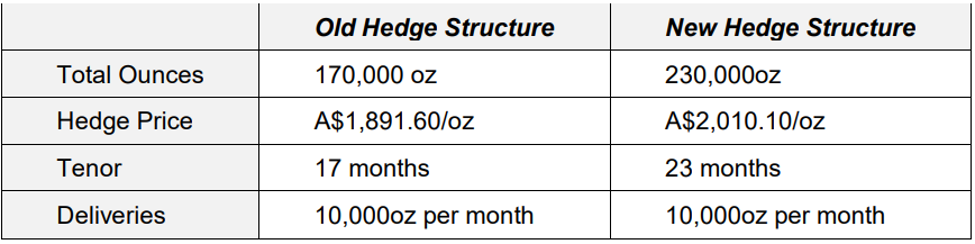
WGX Hedge Book (Source: Company Reports)
Top 10 Shareholders: The top 10 shareholders have been highlighted in the table, which together form around 46.66% of the total shareholding. Ruffer LLP and United Fiber System Ltd. hold maximum interests in the company at 9.33% and 7.25%, respectively.
Top 10 Shareholders (Source: Thomson Reuters)
A Quick Look at Key Metrics: Its gross margin, EBITDA margin and net margin for H1FY20 stood at 4.4%, 5.2% and 4.3%, better than the H1FY19 result of -6.9%, -7.1% and -5.8%, respectively. ROE for H1FY20 was reported at 2.2%, better than H1FY19 result of -2.7%. Its debt to equity multiple for H1FY20 stood at 0.09x, lower than the industry median of 0.22x.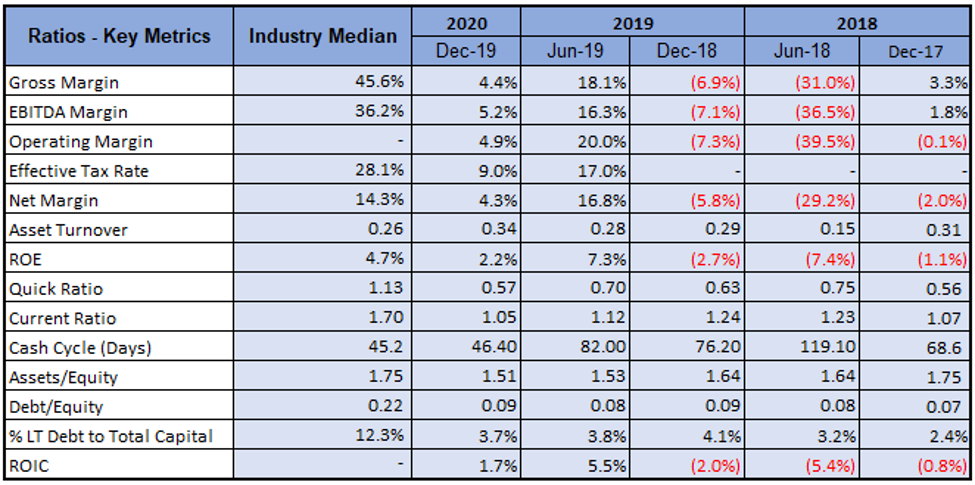
Key Metrics (Source: Thomson Reuters)
Key Risks: The company is exposed to interest rate risk, credit risk, equity price risk, liquidity risk, and commodity price risk. It usually undertakes aging analysis and monitoring of receivables to manage credit risk, liquidity risk, through the development of future rolling cash flow forecasts.
What to expect: As per the release, gold production for FY20 has been estimated at 275 – 300,000oz, as compared to 255,221 oz in FY19 and 253,210 oz in FY18. Cash cost for FY20 has been estimated at A$1,175 - $1,230/oz, as compared to A$1,253/oz in FY19 and A$1,273/oz in FY18. All-in Sustaining cost for FY20 has been estimated at A$1,370 - $1,420/oz, as compared to A$1,408/oz in FY19 and A$1,462/oz in FY18.
Gold Outlook: At the time of writing, the gold spot (XAU/USD) was trading at ~US$1600 (16:00 (UTC+11)). The major rise in gold price can be attributed to global macro-economic concerns particularly regarding novel coronavirus (COVID-19), which has prompted heavy sell-off in the equity market leading to shift in focus towards safe asset classes such as gold. As per the technical analysis, the gold price is trading above 20 EMA, 50 EMA and 200 EMA on the monthly chart, indicating strong bull trend. Looking at the global-economic scenarios, the trend is expected to continue for the sometime, making the outlook for gold as “Stable”.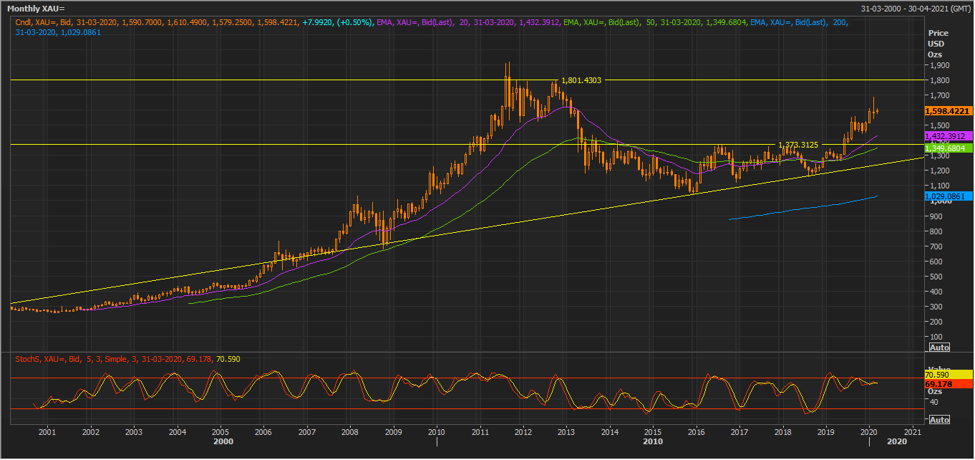
Monthly Chart of Gold Spot (XAU/USD) (Source: Thomson Reuters).png)
Key Valuation Metrics (Source: Thomson Reuters)
Valuation Methodology: P/E Based Relative Valuation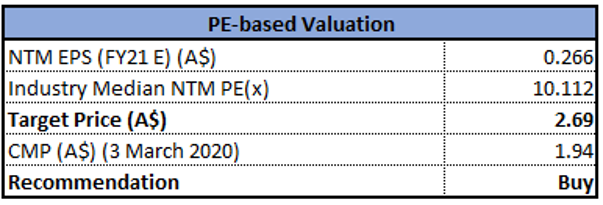
P/E Based Relative Valuation (Source: Thomson Reuters)
Note: All forecasted figures and peers have been taken from Thomson Reuters, NTM-Next Twelve Months
Technical Analysis:
Monthly Chart: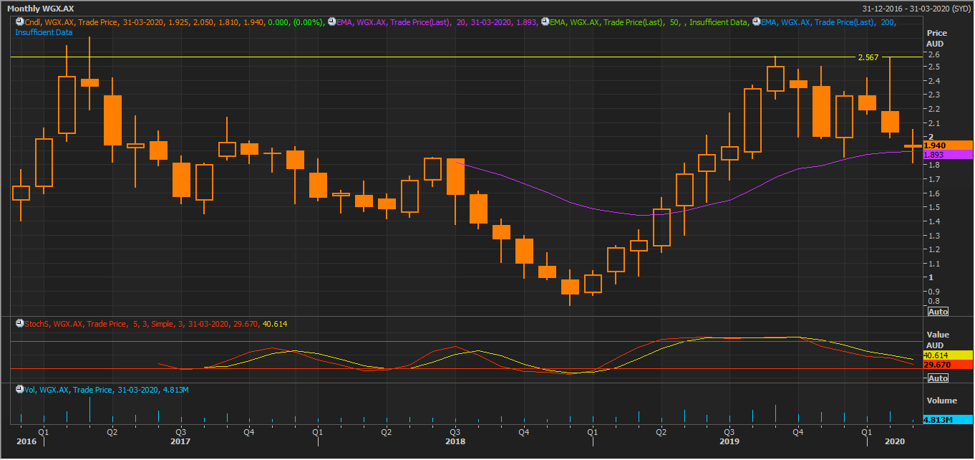
(Source: Thomson Reuters)
Weekly Chart: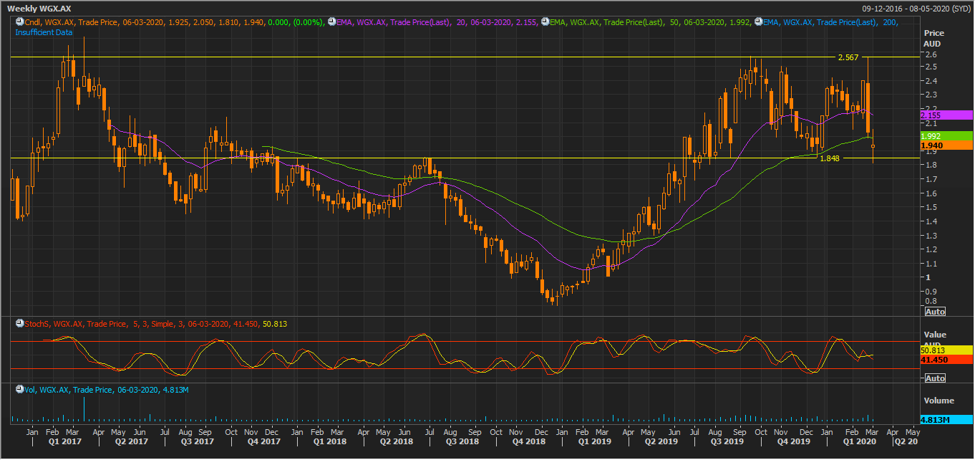
(Source: Thomson Reuters)
On weekly chart, the stock appears to have made a ‘spinning top’ pattern on a strong support level of ~$1.843, which suggests the probability for a bounce back. On monthly chart, the stock appears to trade above 20 EMA, indicating biasness towards bulls. The stock on bounce back is expected to test the resistance level of ~$2.567.
Note: EMA – Exponential Moving Average
Stock Recommendation: WGX’ share posted a whopping one-year return of 77.98%, while in the span of six months, the stock posted a negative return of 19.83%. The stock is currently trading above the average of 52-week high and low of $2.570 and $1.010, respectively. The company reported improvement in the gold production in its first-half of FY20, underpinned by a reduction in the cash cost and AISC cost for the period. Its FY20 guidance has been estimated to be at a better side than the result in FY19. Considering the company’s business operations, H1FY20 performance, profitability margins, leverage ratios, recent update, outlook provided, gold outlook and current trading levels, we have valued the stock using P/E based relative valuation method and arrived at a target price of double-digit growth (in % terms). Hence, we give a “Buy” recommendation on the stock at the current market price of $1.940 on March 03, 2020.
.jpg)
WGX Daily Technical Chart (Source: Thomson Reuters)
Disclaimer
The advice given by Kalkine Pty Ltd and provided on this website is general information only and it does not take into account your investment objectives, financial situation or needs. You should therefore consider whether the advice is appropriate to your investment objectives, financial situation and needs before acting upon it. You should seek advice from a financial adviser, stockbroker or other professional (including taxation and legal advice) as necessary before acting on any advice. Not all investments are appropriate for all people. Kalkine.com.au and associated pages are published by Kalkine Pty Ltd ABN 34 154 808 312 (Australian Financial Services License Number 425376). The information on this website has been prepared from a wide variety of sources, which Kalkine Pty Ltd, to the best of its knowledge and belief, considers accurate. You should make your own enquiries about any investments and we strongly suggest you seek advice before acting upon any recommendation. Kalkine Pty Ltd has made every effort to ensure the reliability of information contained in its newsletters and websites. All information represents our views at the date of publication and may change without notice. To the extent permitted by law, Kalkine Pty Ltd excludes all liability for any loss or damage arising from the use of this website and any information published (including any indirect or consequential loss, any data loss or data corruption). If the law prohibits this exclusion, Kalkine Pty Ltd hereby limits its liability, to the extent permitted by law to the resupply of services. There may be a product disclosure statement or other offer document for the securities and financial products we write about in Kalkine Reports. You should obtain a copy of the product disclosure statement or offer document before making any decision about whether to acquire the security or product. The link to our Terms & Conditions has been provided please go through them and also have a read of the Financial Services Guide. On the date of publishing this report (mentioned on the website), employees and/or associates of Kalkine Pty Ltd do not hold positions in any of the stocks covered on the website. These stocks can change any time and readers of the reports should not consider these stocks as personalised advice.
 Please wait processing your request...