Kalkine has a fully transformed New Avatar.

Company Overview: Xref Limited, formerly King Solomon Mines Limited, is engaged in software development for the human resource (HR) industry. The Company is engaged in online candidate referencing. The Company is engaged in leveraging its database to provide predictive analytics, which enable human resource directors to make data-driven decisions. It is also developing products tailored for the United Kingdom market and managing trials for clients in Canada. It automates the practice of obtaining and verifying references that job candidates provide. It transforms phone-based, manual procedure into a cloud-based, electronic process. It allows the users to request references via the Company. The Company requests referee information from candidate. It gathers background information from referees. It analyses candidate and provides report. It offers data governance, fraud prevention, comparable metrics and customized reports.
Xref Limited
.png)
XF1 Details
A Unique Business Model: Xref Limited (ASX: XF1) has a unique business model. It is engaged in the business of developing Human resource technology which automates the candidate reference process for employers through online platforms and software. The business model encourages the company to report its credit sales when the clients purchase credits and the value of the purchase is treated as unearned income initially. Once the credits are used, the company considers it as a recognised revenue. The company is driven by several ideologies like a steady passion for success, as a result of which it puts people first with its solution and in its workplace. The company is motivated by the constant desire to succeed and believes in providing extreme value. Driven by ambition, there is a goal of the company to deal with things differently in order to make a real difference in whatever the company does. It is into changing the traditional processes by building meaningful and relevant solutions. The company serves several industries including Technology, Consumer Products, Transport, Recruitment, Finance, Advertising, Telecommunications, Healthcare, Hospitality, Construction.
The company boosts the hiring efficiency of its clients and delivers a seamless experience. It ensures the validity of every hire as it implements a best practice referencing process to ensure the validity of the same. The company hires good, honest people and monitors multiple touchpoints during the referencing process and notifies of any suspicious activity. It can be connected to a spectrum of existing tools. Turning to security & compliance, the company based on the highest security standards and quality management practices. A committee of global experts developed and regulates the ISO Standards leading the company to be regulated and assessed by an external body, which ensures that the company adheres to best practices for risk, security, and quality control. It has secured data centres across the world and uses Amazon Web Services, which is a world’s leading cloud storage provider. From the analysis standpoint, the company, in FY18, recorded a top-line of $7.1 million, substantially up 72% on prior corresponding period. This robust growth was largely contributed by Australia, New Zealand, Europe and North America. Sales cycle also witnessed an improvement of 55%, declining to 39 days from 80 days. On the similar line, FY18 recognised revenue also posted a solid pcp growth of 63% to $4.8% million. The company, in the period, successfully raised capital of $7.5 million. Overall, during FY18, Xref improved its performance with three key business metrics – client acquisition, client adoption and average revenue per account, driving it towards global growth and profitability. The company's revenue has grown at a CAGR of ~184.6% over the period of FY14-FY18. We presume that the company has a decent outlook at the back of continued client acquisitions across the region, large addressable market, technology improvement, and increasing Average Revenue Per Account over the past few years.
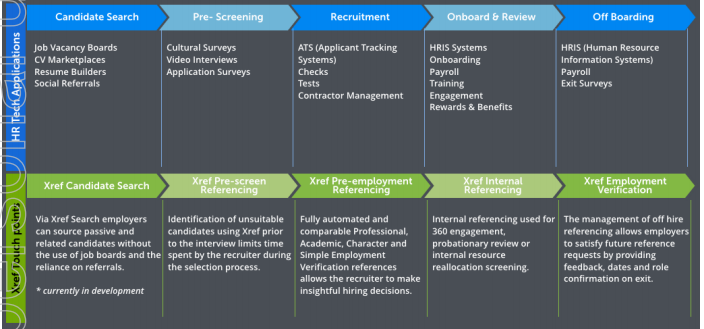
Business Model (Source: Company Reports)
Top 10 Shareholders: Top ten shareholders form around 60.90% of the total shareholding as highlighted in the below table. Griffiths (Timothy David), Seymour (Lee-Martin John) holds maximum interest in the company with a stake of 18.64%each, followed by AustralianSuper and FIL Investment Management (Australia) Limited with 6.04% and 4.38% respectively.
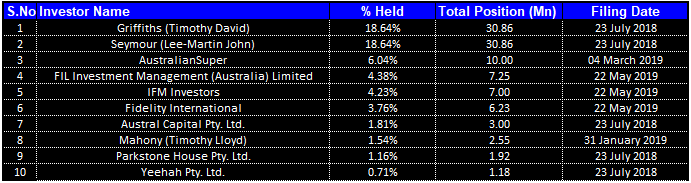
Top Ten Shareholders (Source: Thomson Reuters)
XF1 caters to large addressable market across the globe- : The company has a large addressable market including more than 180 million employees in North America, 120 million employees in Europe, and 15 million employees across Australia & New Zealand.

Global Addressable Market (Source: Company Reports)
1HFY19 Financial Highlights: The company posted its most successful first half results. The revenue of the group continued to increase; however, the group maintained tight control of costs. The credit sales for H1 FY19 were $4.2 million, up 59% from $2.6 million in H1 FY18. However, the consolidated entity reported a loss of $4,592,778 for the financial half-year which was down 9% as compared to $5,073,229 in H1 FY18. The credit usage was $3.4 million, up 88% from $1.8 million in H1 FY18. The increase in usage was underpinned by strong growth in the usage by North American clients of 300%. North American usage was $219,000, up from $44,000 in H1 FY18.
The strong sales growth trend of the company continued throughout H1 FY19. The first-half sales growth of the company was typically lower than sales growth in the second half, on the back seasonal fluctuations.
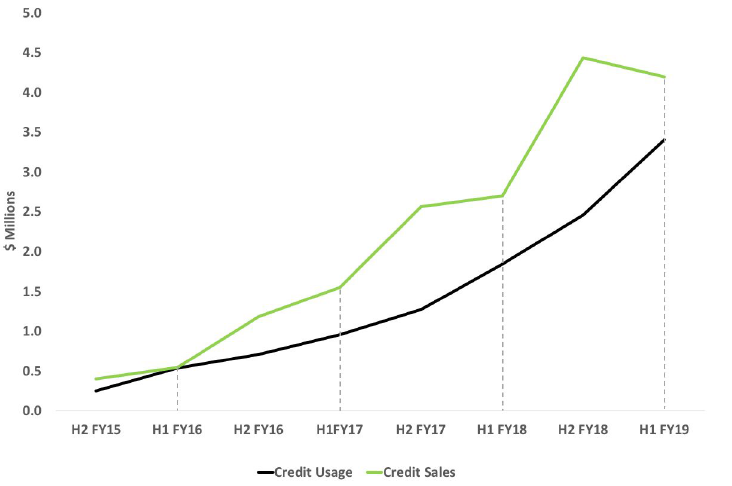
Sales Trajectory (Source: Company Reports)
Growth In Client Acquisition: The number of organizations that the company support globally grew significantly during the period, with the number of active clients using the platform increasing to more than 980 in the first half of the year. During the first half of FY19, 211 new clients adopted the platform of the company, which represents growth of more than 35% as compared to the previous corresponding period. Of these clients, 108 were added during the second quarter. Few landmark businesses were added to the client portfolio of the company during the quarter ended in March 2019. It includes Bunnings Group, the Department of Corrections, Nearmap in the Asia Pacific Region. It also includes New Zealand Customs Service, New Zealand Post, PageGroup, Queensland Police, and Sky News.
Across the EMEA region, the company introduced Color line AS, The Crown Estates, Ocean Installer AS, Sykehuspartner AS and Telia Norge AS and in North America. Few key acquisitions included Kipp LA Schools, Zoom Video Communications and Arbor Memorial Services.

Company Integrations (Source: Company Reports)
Growth In Average Revenue Per Account (ARPA): The average sales revenue from clients during the second half of FY18 and the first half of FY19 was $12,544. This is an increase of 32% since the Average Revenue Per Account (ARPA), which was first introduced as a metric for the company in January 2018. This is a demonstration of the company’s ability to increase in client adoption over time.
Increase In Usage & Channel Sales: Sales of credits to clients through platform integrations reached $750,000 during the first half of FY19, which represented 18 per cent of the overall result. Credit usage by these channel customers was $600,000, which represents a 300 per cent increase on H1 FY18. Users using Xref through an integration, increased to 164 in Q2 FY19 from 136 in Q1 FY19 which is a ~20.58% increase.
Self-serve plans to expedite sales cycle: The company is committed to enhancing efficiencies in the sales process, back of which it has reduced its average sales cycle from 97 days in Q3 FY18 to 33 days in Q3 FY19. Further, the company is currently focussing on making a one-day sales cycle a reality by offering new users a frictionless introduction to the platform. The plans for this significant upgrade of the business model are now underway and the company will update accordingly.
Growth In North America: Xref has doubled the size of its team in North America to ten, including a Regional Sales Manager in Vancouver. As a result, the credit usage has grown by 300% from $44,000 in H1 FY18 to $219,000 in H1 FY19.
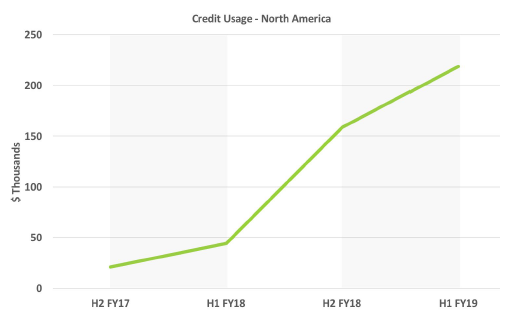
Credit Usage In North America (Source: Company Reports)
Growth In Cash Flow: The sales of the company is increasing at a higher pace than overall expenditure, which is leading to an improvement in the operating leverage. The ratio of cash inflows as a proportion of expenditure has continued to grow and, during H1 FY19, it increased to 60%, up from 35% in H1 FY18 for the group.
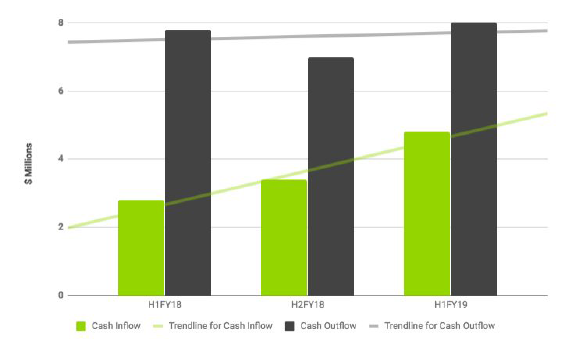
Cash Flows Comparison (Source: Company Reports)
Cash Outflows for Q2 were $3.77 million, in line with the Management’s expectations and the estimate from the September 2018 Appendix 4C. Estimated Cash Outflows for Q3 are $3.98 million and Cash Inflows are expected to continue to grow during the remainder of FY19. The cash at 31 December 2018 stood at $11.11 million and the company remained debt-free.
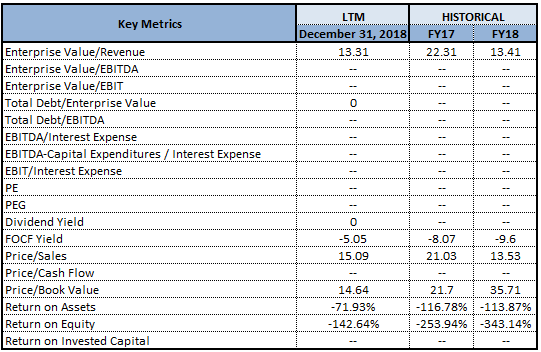
Key Ratios (Source: Thomson Reuters)
The platform Evaluation & Data Analytics: The number of candidates and referees using the Xref platform grew to 1.5 million across 195 countries during the March quarter 2019. Among these, 38 per cent of the profiles were created in the nine months leading to 31 March 2019.
The company is currently building features and products using insights and experience gained by leveraging its data & analytics capabilities. The innovation will enhance value addition for existing clients and strengthen the competitive advantages of the company among its peers and generate incremental revenue opportunities throughout the globe.
Outlook: The company will keep enhancing the continued growth in client acquisition, organic growth in ARPA and additional revenue streams from new products and services sold by account managers. To capitalize on the company’s first mover advantage and the substantial global market opportunity, it plans to hire nine new sales and account managers by the end of FY19.
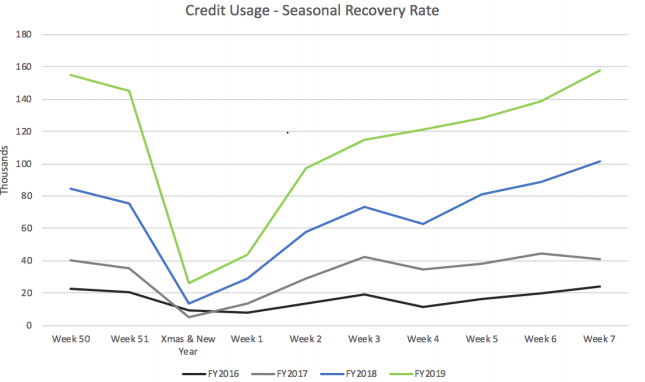
Credit Usage- Seasonal Recovery Rate (Source: Company Reports)
Stock Recommendation: The stock has gained 21.28% over the past six months. However, it remained significantly volatile with a negative return of 13.64% in the last 1-month. Currently, the stock is trading slightly above the average of 52 week high and low prices of around $0.56. The company thrives on robust business drivers including First Mover Advantage, Unique Business Model, and a huge Global Addressable Market. Further, strong client acquisition growth along with the growth in other key financial indicators like Average Revenue Per Account, cash flow and increase in usage & sales channel places the company for improved performance, going forward. Moreover, the business has been supported by a growth in sales in the North American region. Hence, considering the aforesaid facts and current trading level, we recommend a “Speculative Buy” rating on the stock at the current market price of $0.570 per share.
.png)
XF1 Daily Chart (Source: Thomson Reuters)
Disclaimer
The advice given by Kalkine Pty Ltd and provided on this website is general information only and it does not take into account your investment objectives, financial situation or needs. You should therefore consider whether the advice is appropriate to your investment objectives, financial situation and needs before acting upon it. You should seek advice from a financial adviser, stockbroker or other professional (including taxation and legal advice) as necessary before acting on any advice. Not all investments are appropriate for all people. Kalkine.com.au and associated pages are published by Kalkine Pty Ltd ABN 34 154 808 312 (Australian Financial Services License Number 425376). The information on this website has been prepared from a wide variety of sources, which Kalkine Pty Ltd, to the best of its knowledge and belief, considers accurate. You should make your own enquiries about any investments and we strongly suggest you seek advice before acting upon any recommendation. Kalkine Pty Ltd has made every effort to ensure the reliability of information contained in its newsletters and websites. All information represents our views at the date of publication and may change without notice. To the extent permitted by law, Kalkine Pty Ltd excludes all liability for any loss or damage arising from the use of this website and any information published (including any indirect or consequential loss, any data loss or data corruption). If the law prohibits this exclusion, Kalkine Pty Ltd hereby limits its liability, to the extent permitted by law to the resupply of services. There may be a product disclosure statement or other offer document for the securities and financial products we write about in Kalkine Reports. You should obtain a copy of the product disclosure statement or offer document before making any decision about whether to acquire the security or product. The link to our Terms & Conditions has been provided please go through them and also have a read of the Financial Services Guide. On the date of publishing this report (mentioned on the website), employees and/or associates of Kalkine Pty Ltd do not hold positions in any of the stocks covered on the website. These stocks can change any time and readers of the reports should not consider these stocks as personalised advice.
 Please wait processing your request...